What Crohamhurst is
Crohamhurst is a calculator. It runs five astro-technical computations that traders have historically done by hand, and it shows you the numbers. It does not tell you what to buy, when to buy it, or what any market is going to do. There are no signals, no scores, no recommendations and no forecasts anywhere in the product.
Everything astronomical is computed from the JPL DE421 planetary kernel using Skyfield, the same ephemeris data professional astronomers work from. Nothing is approximated from a lookup table and nothing is guessed.
| Module | What it answers | Guide |
|---|---|---|
| Planetary Ephemeris | On which dates do these two bodies form this angle? | Read |
| Bradley Siderograph | What does Bradley's 1948 planetary index look like over this period? | Read |
| Gann Square of Nine | Which prices sit at fixed angles from this anchor on Gann's spiral? | Read |
| Cycle Scanner | Which repeating periods carry the most energy in this price series? | Read |
| Historical Analogs | Which past dates had planetary positions closest to this one? | Read |
Creating an account
- Go to crohamhurst.app/app/register. Or click "Get started free" in the header of any page.
- Enter an email address and a password. The password must be at least 8 characters. There is no email verification step, so you are signed in the moment the account is created.
- You land on the dashboard. New accounts start on the Free tier with no card required and no trial clock.
Your session is held in a secure, HTTP-only cookie that lasts seven days. After that you sign in again. If you forget the password, use the forgot-password link on the sign-in page: a reset link is emailed to you and is valid for one hour.
Finding your way around
The dashboard is one page with a module switcher. Pick a module, fill in its form on the left, and the result appears below it. Your compute unit balance for the day sits in the header and updates after every successful run.
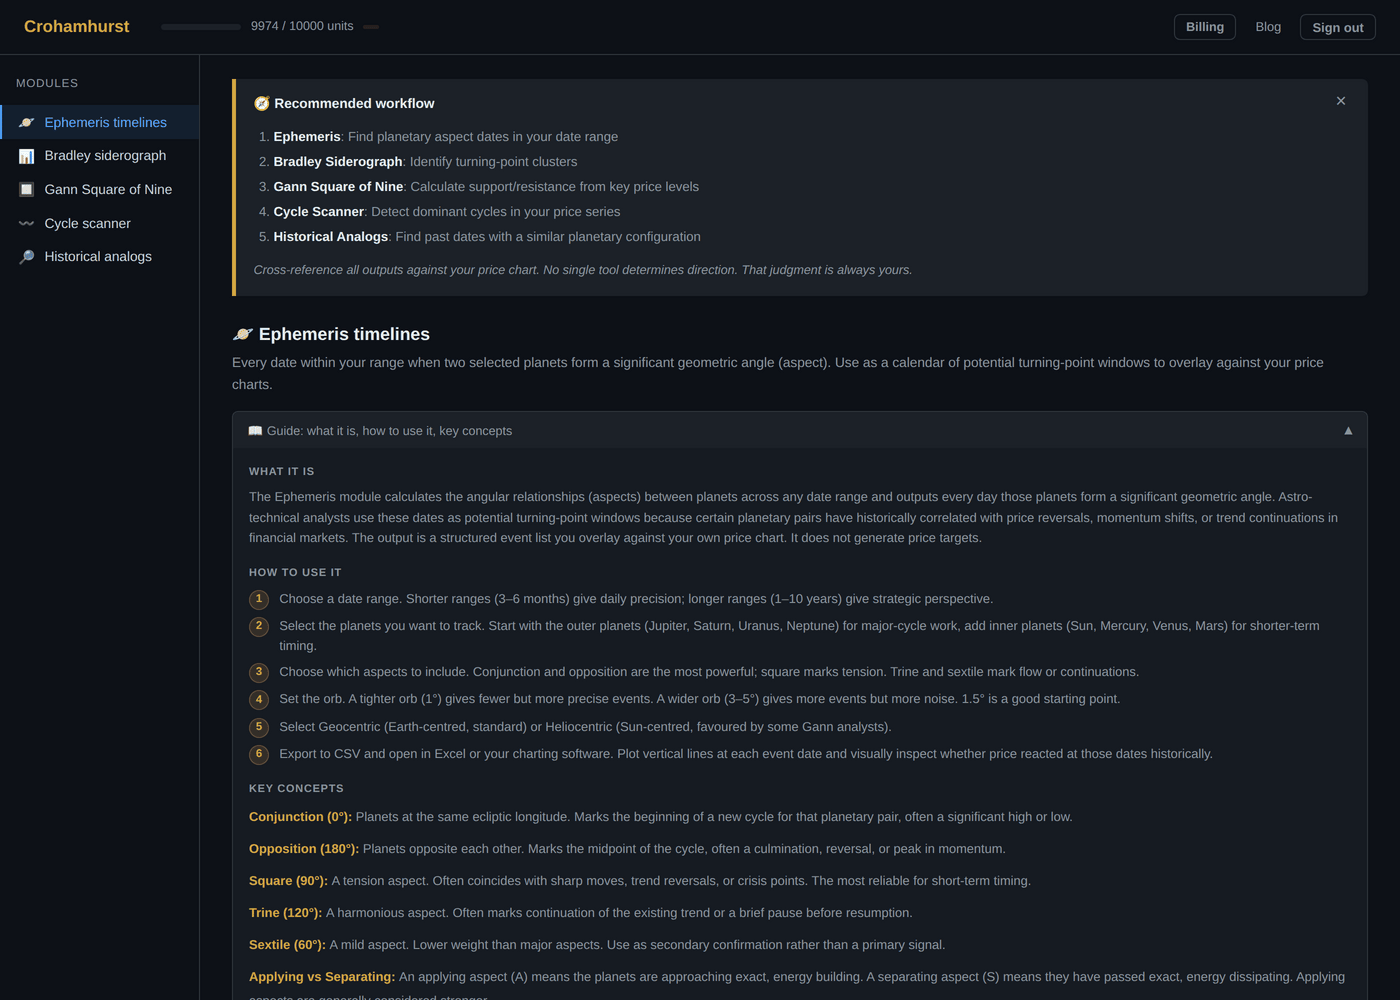
Every module has its own Download CSV button on the result. There is no saved history: results live in the page until you run something else. Export anything you want to keep.
Every result is drawn before it is tabulated. The chart sits between the summary bar and the table, and carries its own SVG, PNG and PNG light download buttons alongside the CSV. Those downloads are made in your browser, so they cost no units. See reading and exporting the charts.
How compute units work
Every computation costs units. The cost depends on how much work you asked for, not on which plan you are on, and the price is the same for everyone.
| Module | Cost | Cheapest run | Dearest run |
|---|---|---|---|
| Gann Square of Nine | Flat rate | 1 | 1 |
| Planetary Ephemeris | 2 units per year of range | 2 | 20 (10 years) |
| Bradley Siderograph | 3 units per year of range | 3 | 30 (10 years) |
| Cycle Scanner | 1 unit per 100 bars | 1 | 20 (2,048 bars) |
| Historical Analogs | 1 unit per 10 years scanned, floor 3, ceiling 10 | 3 | 10 (100 years) |
Three things worth knowing about units
Failed requests are free. Usage is recorded only after a computation succeeds, so a validation error, a date out of range or a refused input does not spend anything.
Viewing costs nothing. Reading a result, downloading a CSV, changing plan and everything to do with your account are all free. Only a computation costs units.
The counter resets at midnight UTC, not at midnight where you are. In Brisbane that is 10:00 the next morning.
Plans and what actually differs
All six modules are open on every plan, Free included. Two things genuinely change with the plan.
| Plan | Price | Compute units per day | Price history from the instrument picker |
|---|---|---|---|
| Free | $0 | 50 | No |
| Hobbyist | $19/mo or $190/yr AUD | 1,000 | No |
| Pro | $49/mo or $490/yr AUD | 10,000 | Yes |
Price history matters for the Cycle Scanner and, optionally, for cross referencing in Historical Analogs. On Free and Hobbyist the "load from instrument" dropdown will not fetch a series. You can still use the Cycle Scanner on any plan by pasting your own closes or uploading a CSV, and it behaves identically. The gate is on our data feed, not on the computation.
Live single prices, used to fill in a Gann anchor, are available on every plan.
Where prices come from
Instrument prices are pulled from Yahoo Finance for 25 instruments across energy, metals, grains, softs and indices. They can lag and may differ from your broker's quote. Crohamhurst does not store price data: whatever is fetched, pasted or uploaded is used for the computation and discarded.
Billing
Payments run through Stripe. Prices are in Australian dollars and include GST. Monthly and annual subscriptions can be cancelled at any time and you keep access until the end of the period you have paid for, after which the account returns to Free.
To change a card, download an invoice or cancel, click Billing in the dashboard header. That opens the Stripe Customer Portal. Full terms are on the pricing page and in the refund policy.
Your first ten minutes
- Run a Square of Nine. It costs 1 unit, needs one number, and returns immediately. Type any price you follow into the anchor field and look at the ladder. See the Square of Nine guide.
- Run a one year ephemeris. Pick Mars and Saturn, tick conjunction and opposition, leave the orb at 1.5 and set a twelve month range. That is 2 units and gives you a short, readable table. See the Ephemeris guide.
- Run a Bradley siderograph for the same year. 3 units. Compare its turning point dates against the aspect dates you just produced.
- Paste 200 closes into the Cycle Scanner. 2 units, no plan required. Read the power percentages before the rankings. See the Cycle Scanner guide.
- Run a 20 year analog scan on today's date. 3 units, and the cheapest way to see what the module does. See the Historical Analogs guide.
- Hover the similarity curve on that scan and find its highest peak, then check the date against row 1 of the table. That is the fastest way to learn how the charts and the tables relate. See reading and exporting the charts.
That whole sequence costs 11 units out of the 50 a Free account gets each day.
What Crohamhurst will never do
- It will not tell you what to trade. No buy or sell output exists anywhere in the product, and none is planned.
- It will not score or rank an opportunity. Where a label like "cardinal" or "high" appears, it describes geometry, not likelihood.
- It will not back test a method for you. The modules compute what they say they compute. Whether any of it predicts anything is a research question we leave with you.
- It will not keep your price data. Nothing you paste or upload is retained.
If you want signals, this is the wrong tool
That is a deliberate design decision, not a missing feature. Crohamhurst gives you dates, degrees, levels and tables, computed correctly and documented honestly, and expects you to do the interpretation. If you are looking for something that tells you what to do, buy something else.
Not financial advice
Crohamhurst is a calculation tool. It produces dates, degrees, levels and tables. It does not produce recommendations, signals or forecasts, and nothing in this guide is financial advice. Trading carries risk of loss.