What it computes
The Square of Nine is a spiral of numbers. Start at 1, wind outwards, and every full turn of the spiral lands you back on the same compass direction one ring further out. Gann used it to relate prices to angles. Crohamhurst implements the arithmetic of that spiral and nothing more.
Two formulas do all the work. The first converts a price to an angle on the spiral:
The second goes the other way, converting a ring and an angle back to a price:
One full turn of the spiral adds exactly 2 to √P. That gives three identities worth memorising, where B is your anchor price:
| Rotation from the anchor | Resulting price |
|---|---|
| 90°, a quarter turn | (√B + 0.5)² |
| 180°, a half turn | (√B + 1)² |
| 360°, a full turn | (√B + 2)² |
Given an anchor price, the module places it on the spiral, then generates every level that sits on your chosen axes across a band of rings around it. The output is a price ladder.
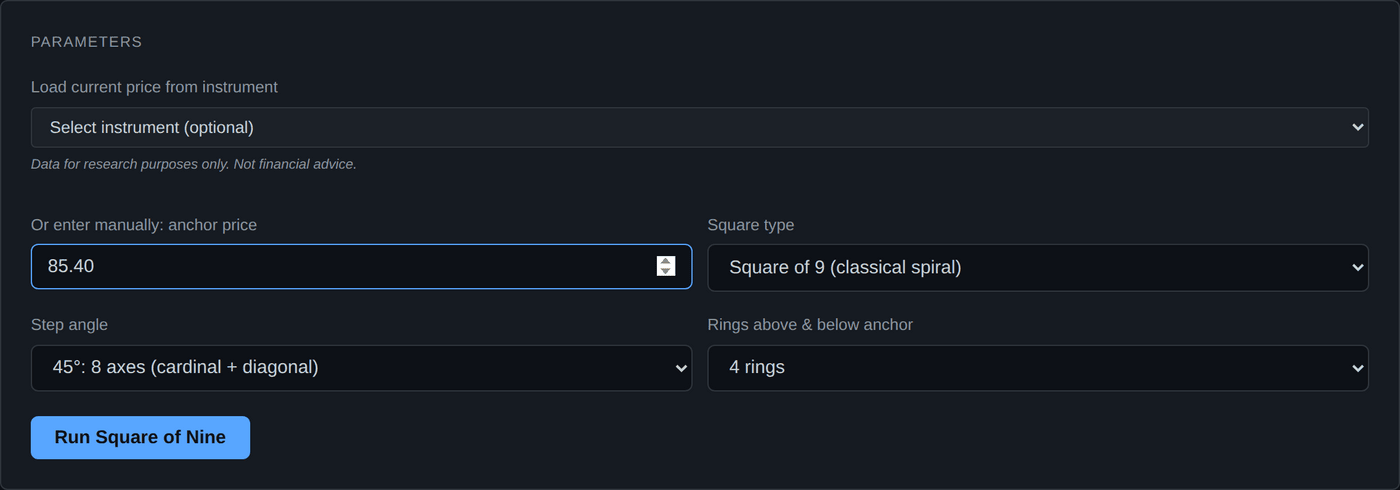
Every input field
| Field | Accepted values | Default | What it does |
|---|---|---|---|
| Load current price from instrument | Any of the 25 supported instruments | Empty | Fills the anchor price with the latest quote from Yahoo Finance. Optional. Available on every tier. |
| Anchor price | Greater than 0, up to 1,000,000 | Empty, required | The price the spiral is centred on. Usually a significant high, low or current price. |
| Square type | Square of 9 | Square of 9 | Only the classical spiral is available. |
| Step angle | 45° (8 axes) or 22.5° (16 axes) | 45° | How finely the circle is divided. 22.5° gives twice as many levels. |
| Rings above and below anchor | 2, 3, 4, 5, 6 or 8 | 4 | How far out from the anchor to generate levels. The API accepts 1 to 8. |
The Square of 144 was removed
An earlier version offered a sq144 option. It was withdrawn because its implementation was mathematically incorrect, and the API now refuses that value outright rather than returning numbers that look plausible and are not. Only sq9 is accepted.
Worked example
Build a level ladder around a crude oil price of 85.40.
- Open the module. Sign in, then choose Gann Square of Nine on the dashboard.
- Set the anchor. Either pick WTI Crude Oil from the instrument dropdown, which fills in the live quote, or type
85.40into the anchor price field. - Leave the step angle at 45°. That gives eight axes: the four cardinals at 0°, 90°, 180° and 270°, and the four diagonals at 45°, 135°, 225° and 315°.
- Leave rings at 4. You will get levels from one ring below the anchor to four rings above it.
- Click Run Square of Nine. The summary bar shows the anchor, the angle it maps to on the spiral, the number of levels generated and the unit charge.
- Read the price ladder. It shows the sixteen levels closest to your anchor, with the anchor row highlighted in green. The horizontal bar is a visual scale of the percentage distance, not a measure of importance.
- Scroll to the full table for every level, sorted by price.
- Re-run at 22.5° to see the sixteen axis version. The cardinal and diagonal levels do not move. You are adding levels between them, not changing the existing ones.
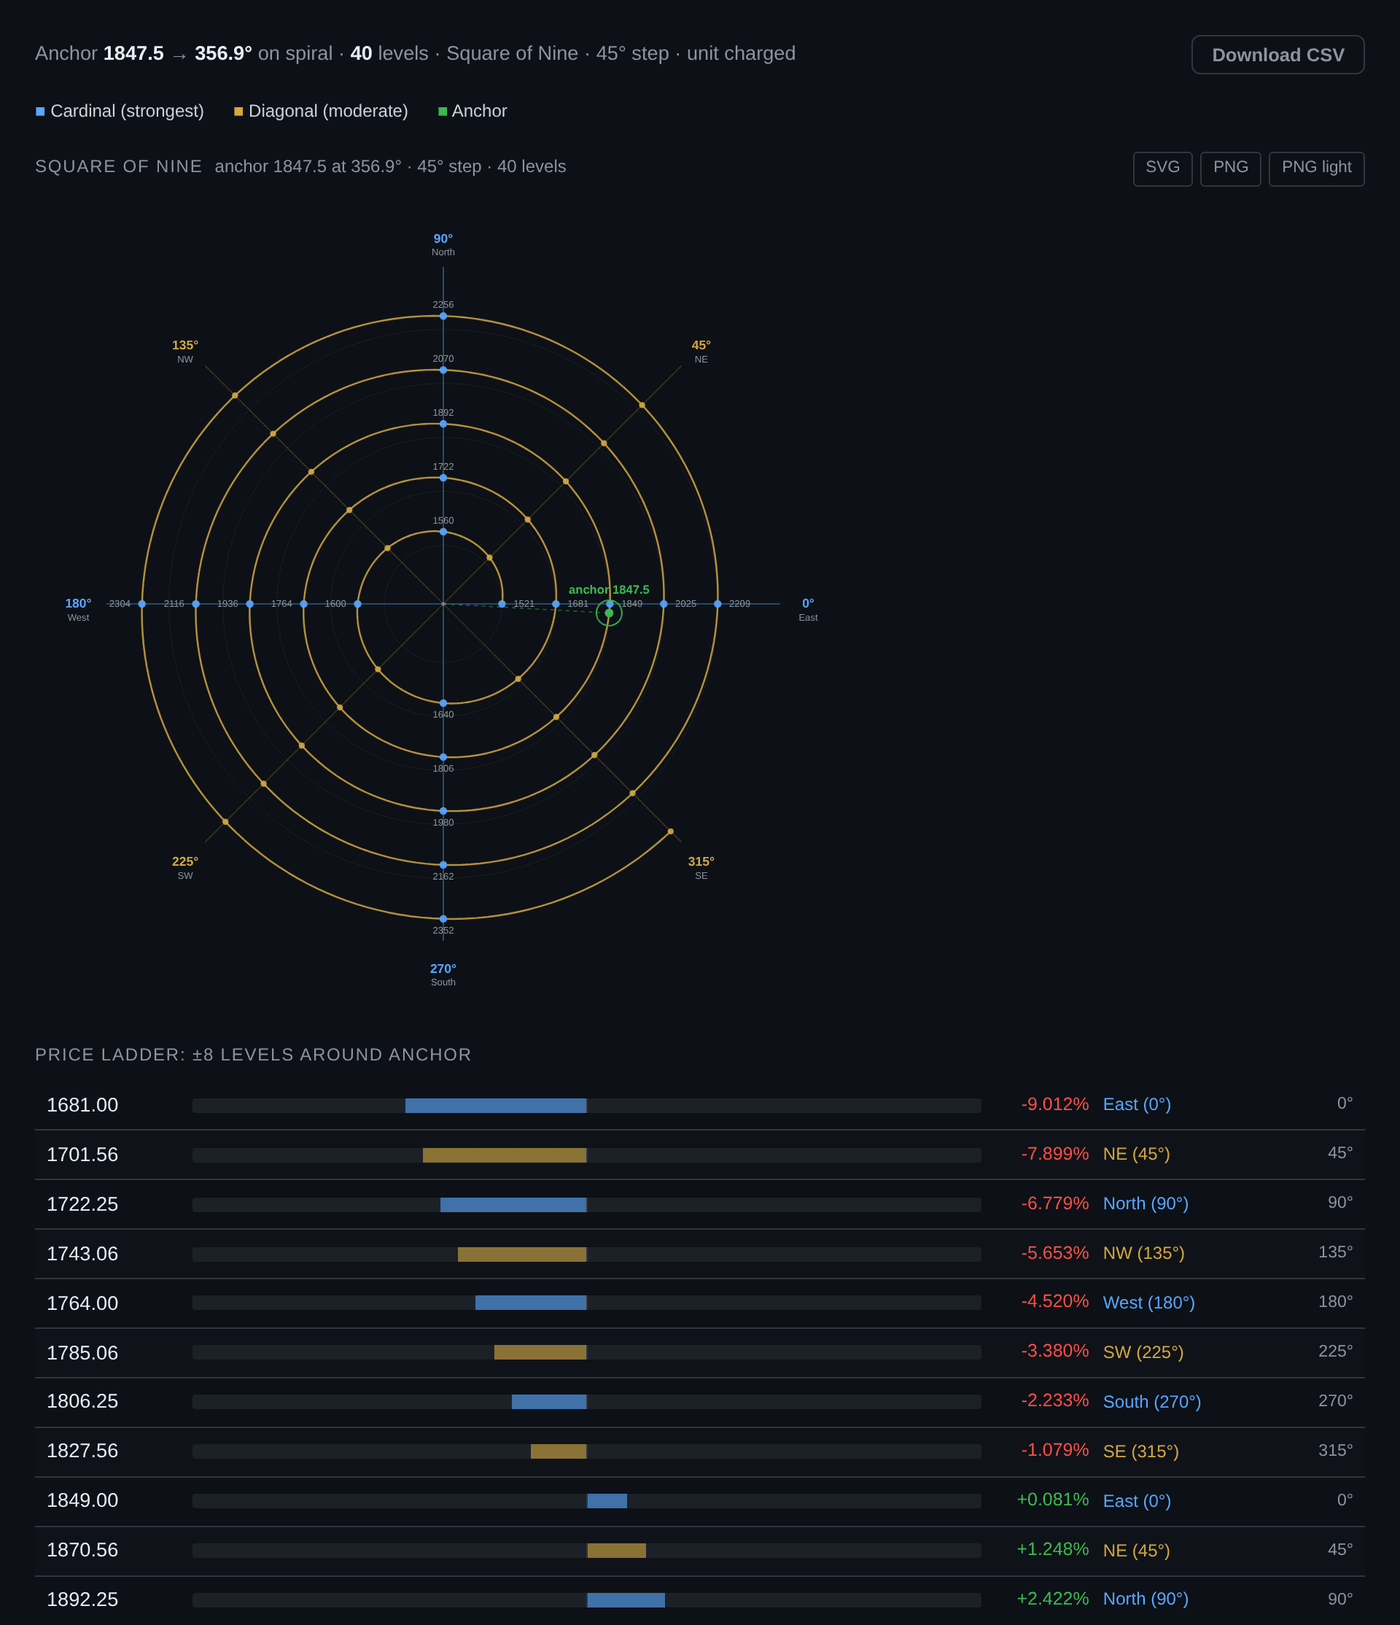
Reading the chart
The result panel draws the wheel before it lists the levels. It sits between the summary bar and the level table, so you meet it as soon as you scroll down from the form. There is nothing to switch on.
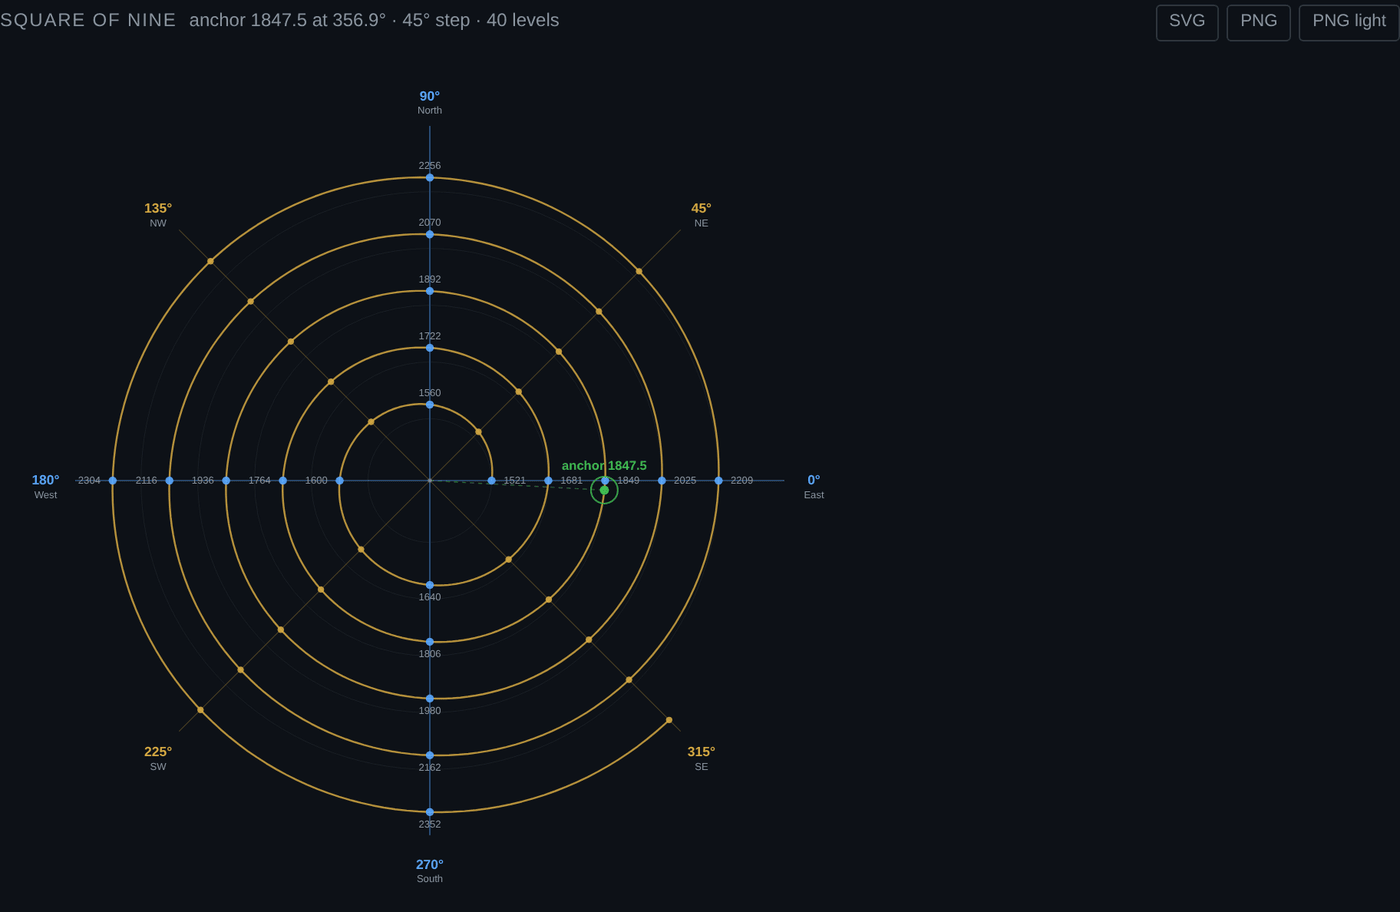
Why it is a spiral and not a set of rings
Most printed Squares of Nine show concentric rings, which quietly loses the property that makes the thing work. Price advances continuously, and one full turn of 360° carries you out by exactly one ring. So position here is set by the cumulative angle, and the radius grows in step with it. Every level the API returned lies exactly on the spiral, rather than being snapped onto the nearest circle.
Read it the way the numbers run: outward is a higher price, one lap is one ring, and two levels sitting on the same radial line are one full rotation apart.
What each mark means
| Mark | Meaning |
|---|---|
| Gold spiral | The continuous price curve. Everything else is a point on it |
| Blue dot | A level on a cardinal axis, at 0, 90, 180 or 270 degrees. Traditionally the strongest |
| Gold square | A level on a diagonal, at 45, 135, 225 or 315 degrees. Traditionally moderate |
| Green ringed marker | Your anchor, labelled with its price so you can always find where you started |
| Radial labels | The eight axes, each labelled with its angle and compass name, with the price at every ring printed along it |
The angle convention is stated on the chart and is the same one the app uses everywhere: 0° is East and the angle increases anticlockwise, so North is 90°. It matches the zodiac wheel in the Ingress module deliberately, so the two never have to be read in opposite directions.
The worked example, read off the wheel
Take the run above. The header says the anchor 1847.5 lands at 356.9° on the spiral, which is a hair short of due East, and 40 levels were generated at a 45° step.
Follow the East axis outward and the prices printed along it read 1521, 1681, 1849, 2025, 2209. Those are one full rotation apart from each other, and 1849 is the one sitting almost on top of the anchor, which is the visual confirmation that 356.9° is very nearly zero. Follow North instead and you get 2256, 2070, 1892, 1722, 1560, running the other way because that axis is being read inward as well as outward.
So the wheel answers, at a glance, the question the table answers row by row: which levels are on the strong axes, how far the ladder reaches in each direction, and where your anchor sits inside it.
Cross-check it once
Pick any blue dot, note the price beside it, then find the same value in the level table underneath. The chart and the table are two views of one response, never two calculations. See reading and exporting the charts for the download buttons and the hover readout.
Reading the output
| Column | What it is | How to read it |
|---|---|---|
| Price | The level itself | The price at that angle on that ring. This is what you would mark on a chart. |
| Delta % | Percentage distance from the anchor | Signed. Positive is above the anchor, negative is below. Useful for judging whether a level is close enough to be worth marking. |
| Axis | cardinal, diagonal or minor | Cardinal means the angle is a multiple of 90°. Diagonal means a multiple of 45° that is not a multiple of 90°. Minor is everything else, so it only appears at a 22.5° step. |
| Label | Compass name of the axis | Sixteen names are used, from "East (0°)" through "ESE (337.5°)". Purely a readable name for the angle. |
| Angle | Degrees on the spiral | 0 to 360, matching the label. |
| Ring | Which turn of the spiral | Reported as an offset from the anchor's own ring. Offset 0 is the anchor's ring, negative is inside it, positive is outside. |
| Anchor angle | In the summary bar | Where your anchor price itself falls on the spiral. If it happens to sit near a cardinal, your anchor is already on a Square of Nine axis. |
Cardinal, diagonal and minor are geometry labels
The in-app legend calls the cardinals "strongest" and the diagonals "moderate". That reflects the traditional Gann convention, not a measurement. Crohamhurst has not tested whether cardinal levels behave differently from diagonal ones. Treat the labels as telling you the angle, and nothing else.
The CSV export
One row per level, in the same order as the on screen table. This is the form you want if you are importing levels into charting software or a spreadsheet.
Limits and caveats
- Units matter and the tool does not know yours. The square root of a price is not scale invariant. A price quoted at 85.40 and the same price quoted at 8540 cents produce completely different ladders. Pick one convention and keep it.
- The anchor is your choice and it dominates the output. It decides which ring window of the grid you see and where your price sits on the spiral. The levels themselves sit on a fixed grid (squares of multiples of 0.25 at a 45° step), so a different anchor shows a different window of the same prices, not a new set of prices.
- Levels below the spiral centre are skipped. When the ring and angle combination would give a non positive square root, that level is dropped instead of producing a nonsense price. With a small anchor and a wide ring count you may get fewer levels than you expect.
- Ring offsets run from −1. You always get one ring below your anchor plus the number of rings you asked for above it. Four rings gives six offsets in total.
- Live prices come from Yahoo Finance. They may differ from your broker's quote and can be delayed. The app says so on the picker. Crohamhurst stores no price data.
What this tool does not tell you
It does not tell you whether a level will hold, break, or matter. It does not rank levels by likelihood. It is a geometric calculator: you give it an anchor, it returns the fixed grid prices on Gann's spiral that fall in the rings around that anchor. Everything after that is your own research.
Common mistakes
| Mistake | What happens | Fix |
|---|---|---|
| Mixing price units between runs | Two ladders that cannot be compared at all | Decide on dollars or cents once. Note that some instruments here quote in US cents, including wheat, corn, soybeans, coffee, sugar, cotton and orange juice. |
| Entering 0 or a negative anchor | Validation error | The anchor must be greater than 0 and no more than 1,000,000. |
| Expecting the 22.5° step to move the existing levels | Confusion about which run is right | It does not move them. It inserts eight more axes between them. |
| Asking for 8 rings on a small anchor | Fewer levels than expected | Levels inside the centre of the spiral are skipped by design. Use fewer rings on small prices. |
| Treating the ladder bar length as significance | Reading meaning into a drawing | The bar is scaled from delta percent. It is a distance indicator, nothing more. |
What it costs
The Square of Nine is charged at a flat 1 compute unit per run, whatever the anchor, step angle or ring count. It is pure arithmetic with no ephemeris lookup, so it is the cheapest module in the app and the one to use when you are learning.
Units reset daily at midnight UTC, and a failed request costs nothing, because usage is recorded only after a computation succeeds. See pricing for the daily allowance on each plan.
Not financial advice
Crohamhurst is a calculation tool. It produces dates, degrees, levels and tables. It does not produce recommendations, signals or forecasts, and nothing in this guide is financial advice. Trading carries risk of loss.