What it computes
Pick a date. The module reads the ecliptic longitude of each selected body on that date, then walks backwards day by day through history comparing every past day against it. The days whose planetary layout is closest to your target date are returned as analogs.
Closeness is one number. For each body it takes the shorter way round the circle between the two longitudes, then averages across bodies:
That average is then rescaled into the similarity percentage shown in the table:
Two rules shape which days can be returned. The scan stops one year short of the target date, so a "past" analog is never within twelve months of it. And once a day is chosen, every day within 365 days of it is excluded, so you get analogs from different eras rather than five neighbouring days from the same week.
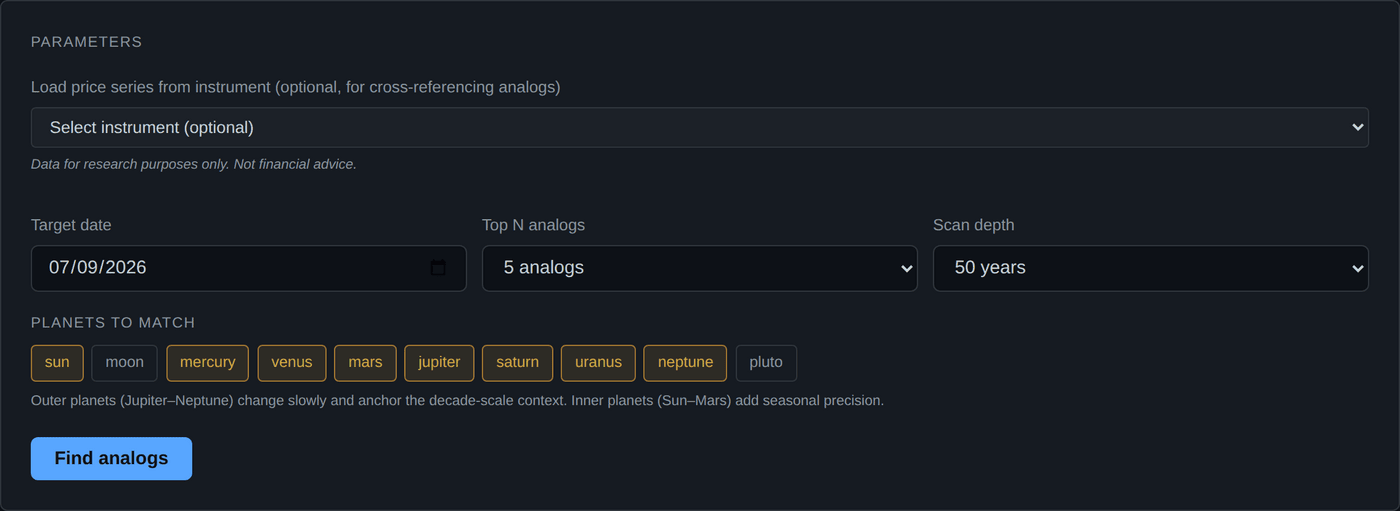
Every input field
| Field | Accepted values | Default | What it does |
|---|---|---|---|
| Load price series from instrument | Any of the 25 instruments | Empty | Optional. Loads a chart alongside the results so you can cross reference the analog dates. Requires Pro, because it uses the price history endpoint. The analog computation itself does not need it. |
| Target date | 1900-01-01 to 2050-12-31 | Today | The date whose planetary layout you are matching against history. |
| Planets | Sun, Moon, Mercury, Venus, Mars, Jupiter, Saturn, Uranus, Neptune, Pluto | All except Moon and Pluto | Which bodies are compared. Every selected body carries equal weight in the average. |
| Top N analogs | 3, 4, 5, 6, 7, 8 or 10 | 5 | How many dates to return, closest first. |
| Scan depth | 20, 30, 50, 75 or 100 years | 50 | How far back to search. Offered in full to every tier. |
Adding the Moon will wreck your results
The Moon moves about 13° a day. Over a fifty year scan it takes essentially every longitude thousands of times, so including it adds a large, effectively random term to the average distance and drowns out the slow planets that make an era distinctive. If you want a lunar match, use the Ephemeris module. Bradley left the Moon out of his formula for the same reason, and the default here follows that.
Worked example
Find the five closest historical parallels to today's sky.
- Open the module. Sign in, then choose Historical Analogs on the dashboard.
- Leave the target date on today, or set the date you actually care about.
- Leave the default eight bodies ticked. Sun through Neptune, no Moon, no Pluto.
- Set scan depth to 50 years. That is about 18,000 days compared against your target.
- Leave Top N at 5.
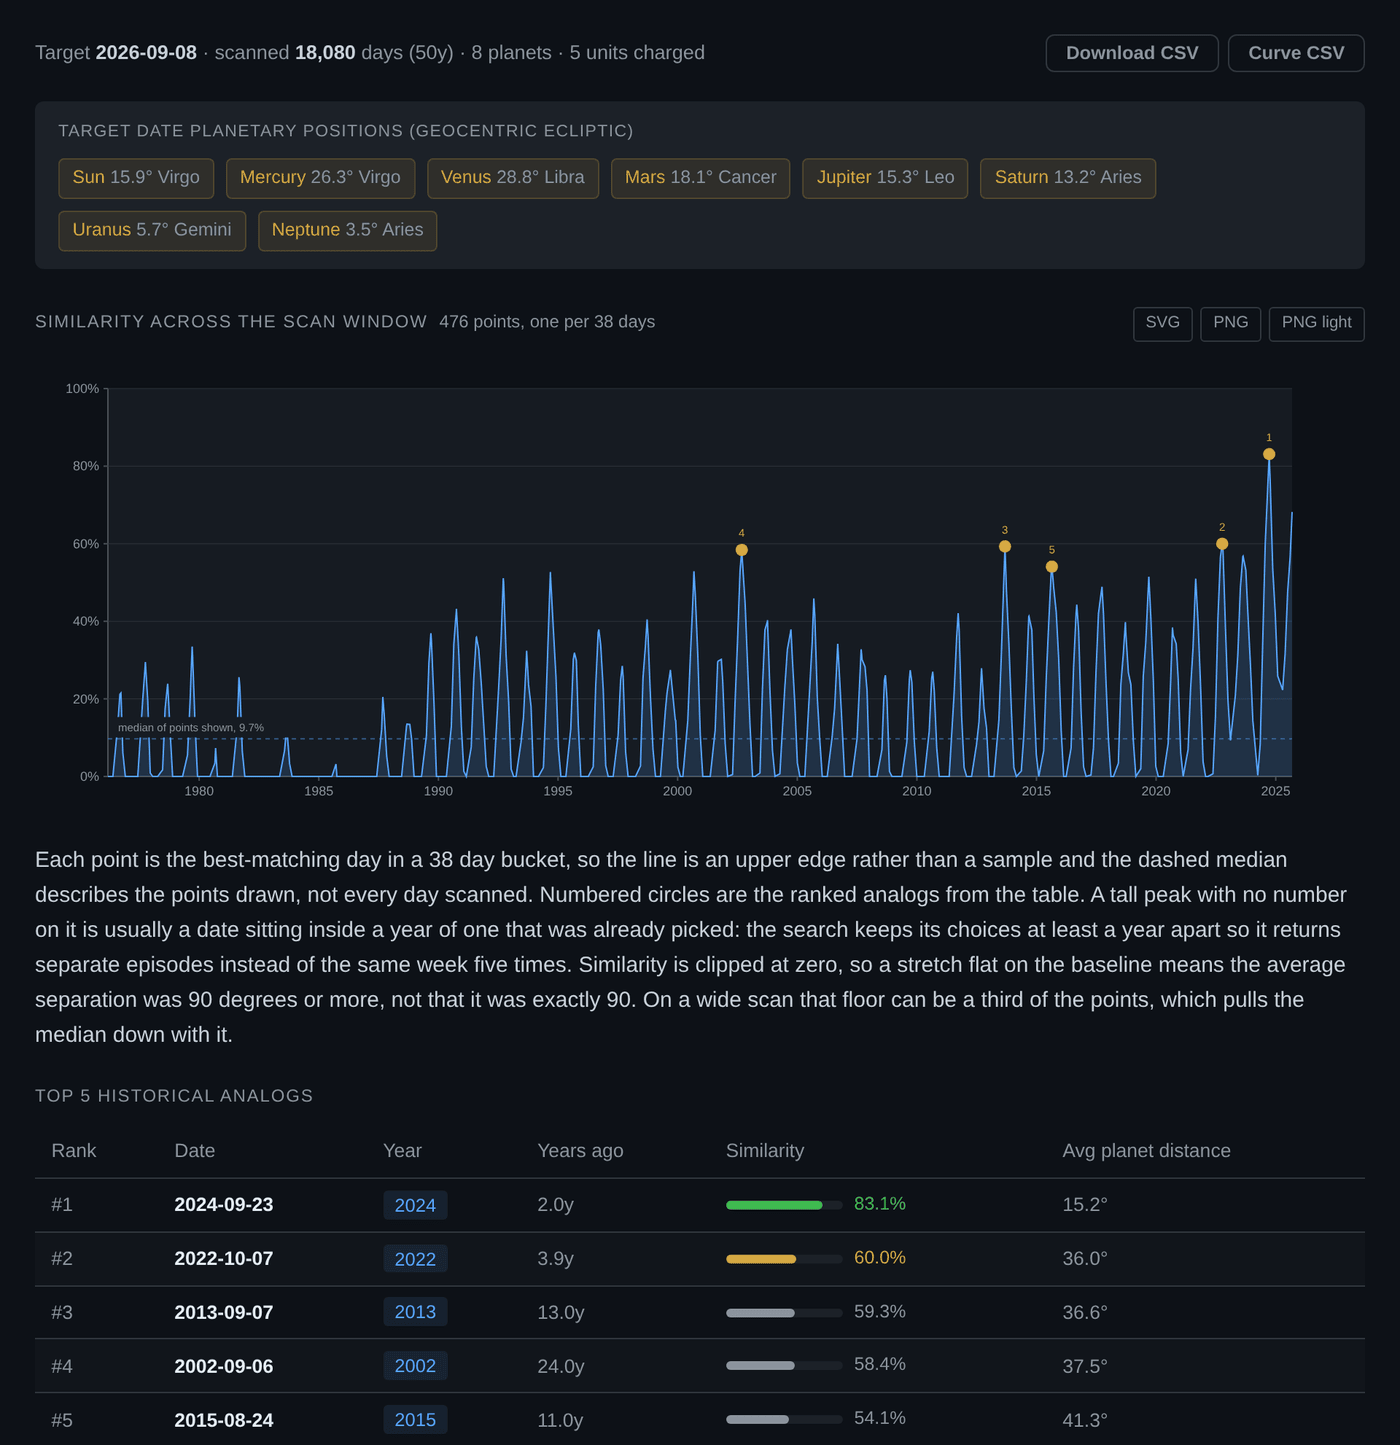
- Click Run. The summary bar reports the target date, the number of days actually scanned, the planet count and the unit charge.
- Read the target positions strip first. Each body's longitude is shown as a zodiac position. This is what history is being matched against.
- Work down the analog table. Note the similarity percentage on each row before you look at anything else. A 40 percent match is a weak one no matter that it ranked first.
- Re-run with Pluto added. Pluto is slow, so it narrows the eras that can match at all. Watch how many of your five dates survive.
Reading the chart
The similarity curve is drawn between the summary bar and the ranked match table. The table gives you the top handful of dates. The chart gives you the whole scan window, which is the context that tells you whether those dates are peaks or just the least bad of a flat field.
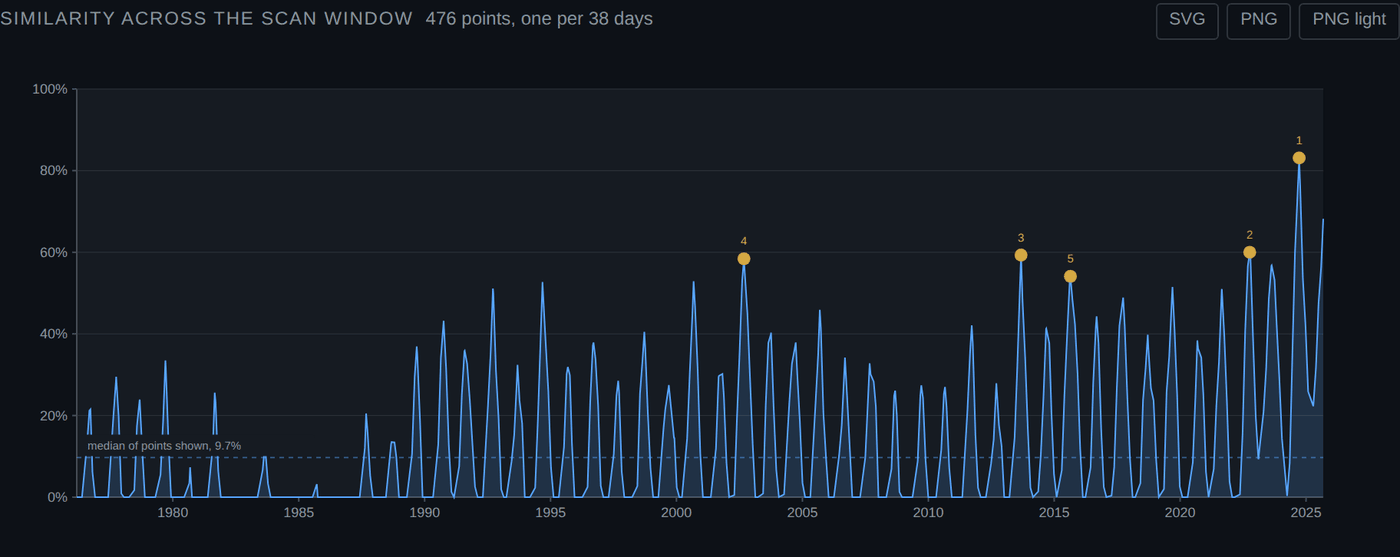
| Mark | Meaning |
|---|---|
| Blue line and fill | Similarity to your target date, sampled across the whole scan window |
| Numbered gold circle | A ranked analog. The number is its position in the table |
| Dashed horizontal line | The median of the points shown, labelled with its value |
The worked example, read off the chart
Hover the tallest peak in the run above and the readout says 2024-09-23, similarity 83.1%. Scroll down and row 1 of the table says the same thing. That is the check worth doing once on any result.
Now look at the dashed line: the median of the points shown is 9.7%. That is very low, and the reason is visible in the shape of the curve. 178 of the 476 points sit exactly on zero, because the similarity measure clips to zero once the mean separation passes 90 degrees. So a large part of the window is not merely a poor match, it is floored, and the median is being dragged down by all of it.
This is exactly why the curve is drawn at all. An 83.1% top match against a 9.7% median looks impressive until you can see that the median is an artefact of the floor rather than a description of a typical day. Read the peak against the shape of the curve, not against the median alone.
The second CSV button
This is the only module with two CSV exports. CSV gives you the ranked matches, which is the table. Curve CSV gives you every point of the line, which is what the chart is drawn from, so you can rebuild the curve or re-scale it yourself. See reading and exporting the charts.
A high similarity is a geometric statement
It says two dates had planetary configurations that resemble each other. It says nothing about what any market did on either date, and the app deliberately does not look.
Reading the output
| Column | What it is | How to read it |
|---|---|---|
| Rank | Order by mean distance | Rank 1 is the closest match found. Rank is relative to your settings, not an absolute quality score. |
| Date | The analog day | A single calendar day, not a window. The days either side are almost as similar. |
| Year | Its year | Convenience for spotting clusters in a single era. |
| Years ago | Distance from the target, one decimal | Always at least 1.0, because the scan stops a year short of the target. |
| Similarity | Percentage, with a bar | 100 percent means an exact longitude match on every selected body. 0 percent means the average was 90° or worse. Judge the number, not the bar length. |
| Avg planet distance | Mean separation in degrees | The raw figure the similarity is derived from. Lower is closer. Under 10° is a genuinely tight match, over 30° is loose. |
| Target positions strip | Longitudes on your target date | Geocentric ecliptic, shown in zodiac notation. Sampled at 12:00 UT. |
| Days scanned | In the summary bar | Can be less than your scan depth implies, because the window is clamped at 1899-08-01. |
The in-app note about "a common directional theme" is not our claim
The blue box under the results table suggests looking up each analog date on your chart and observing the following months. That is a description of how analog work is traditionally done. Crohamhurst does not compute, test or endorse any directional conclusion from it. The software returns dates and degrees. Anything you infer about market direction is yours, is untested by us, and is not advice.
The CSV export
One row per analog, saved as analogs_<target date>.csv. The target positions are not exported. If you want them, take them from the Ephemeris module, which gives full longitudes rather than zodiac labels.
Limits and caveats
- Longitude only. Latitude, declination, distance and speed are not compared. Two dates can score a high similarity while the bodies sit at different declinations.
- Every body weighs the same. A 10° Mercury discrepancy counts exactly as much as a 10° Pluto discrepancy, even though 10° of Pluto spans decades and 10° of Mercury spans days.
- The similarity scale is arbitrary. The 90° denominator is a design choice. It makes the number readable, it does not make it meaningful in an absolute sense.
- Deep scans are clamped by the ephemeris. The DE421 kernel starts on 1899-07-29 and the scan floor is set to 1899-08-01 for margin. A 100 year scan from a target in the 1970s will scan fewer days than 100 years.
- One day per era. The 365 day minimum gap means you never see the second best day of a matching week. That is deliberate, and it means the table understates how long a matching period lasted.
- Sampled at 12:00 UT. Same convention as every other astronomical module here.
What this tool does not tell you
It does not tell you that similar skies produce similar markets. It has not been back tested against price and makes no such claim. It answers one narrow question precisely: which past days had planetary longitudes closest to the ones on your target date.
Common mistakes
| Mistake | What happens | Fix |
|---|---|---|
| Including the Moon | Similarity collapses and the rankings become close to noise | Leave it off unless you specifically want a lunar match and know why. |
| Reading rank instead of similarity | A 35 percent match gets treated as a strong parallel | Something always ranks first. Check the percentage and the average distance. |
| Selecting only fast bodies | Dozens of near identical matches, spread randomly across the scan | Keep at least Jupiter and Saturn in, so the era has to match too. |
| Expecting a 100 year scan from an early target | Fewer days scanned than expected | Check the days scanned figure in the summary. The floor is 1899. |
| Assuming the analog date is a window | Chart work centred on exactly one day | Similarity changes slowly. Treat each analog as the centre of a period, then look at the surrounding weeks yourself. |
What it costs
Analogs are charged on scan depth, at 1 unit per 10 years scanned, with a floor of 3 and a ceiling of 10.
| Scan depth | Units charged |
|---|---|
| 20 years | 3 |
| 30 years | 3 |
| 50 years | 5 |
| 75 years | 8 |
| 100 years, the maximum | 10 |
The number of analogs you ask for does not change the price. Units reset daily at midnight UTC, and a failed request costs nothing, because usage is recorded only after a computation succeeds. See pricing for the daily allowance on each plan.
Not financial advice
Crohamhurst is a calculation tool. It produces dates, degrees, levels and tables. It does not produce recommendations, signals or forecasts, and nothing in this guide is financial advice. Trading carries risk of loss.