Hurst Exponent Explained: A Worked ASX 200 Example
The Hurst exponent, written H, is a single number between 0 and 1 that describes how a series behaves over time. Above about 0.6 the moves have tended to continue (trending). Below about 0.4 they have tended to reverse (mean-reverting). Near 0.5 the series looks like a random walk. We ran it on 258 daily ASX 200 closes and got 0.562, which the app labels a random walk. Here is what that means, how it was worked out, and how far you can lean on one reading.
What the Hurst exponent measures
Most price tools look at direction or level. The Hurst exponent looks at persistence: after a run of up days, is the next stretch more likely to carry on up, or to give some back? It answers that by checking how the range of the cumulative moves grows as you look over longer and longer stretches of time.
In a pure random walk, that range grows with the square root of the stretch length, which corresponds to H of 0.5. If moves tend to persist, the range grows faster and H sits above 0.5. If they tend to reverse, the range grows more slowly and H sits below 0.5.
That is the value of the measurement. It is a repeatable, objective way to ask "does this series behave like a trend, a swing or a coin toss?", and it takes seconds instead of an afternoon with a spreadsheet.
How the app calculates it
The Cycle Scanner uses rescaled range (R/S) analysis. We read the scanner's own source (version 2.0.1) to describe it exactly:
- Take the daily closes and convert them to log returns, the day-to-day percentage changes.
- Cut the returns into blocks of 8, 16, 32, 64 days and so on, up to half the length of the return series.
- In each block, measure the range of the cumulative deviations from the block average and divide it by the block's standard deviation. Average that across blocks of the same size.
- Plot the log of that average against the log of the block size. The slope of the line is H.
The app labels H above 0.6 "trending", below 0.4 "mean-reverting" and anything between "random walk". Those are fixed cut-offs in the code, not statistical tests.
One detail matters a great deal. The scanner runs the calculation on returns, not on price levels. Run on price levels, R/S gives a reading near 1.0 for almost any series, including a pure random walk, which tells you nothing. The source notes this explicitly, and the app avoids it.
The data
We used daily closes of the S&P/ASX 200 (ticker ^AXJO) from Yahoo Finance: 258 closes from 3 November 2025 to 6 November 2026, fetched on 11 November 2026. The index closed at 8,894.8 on the first day and 9,020.8 on the last, a gain of 1.4% (126 points on 8,894.8). In between, the highest close was 9,271.6 on 6 August 2026 and the lowest was 8,365.9 on 23 March 2026.
We pasted the closes as Yahoo supplied them. The feed has some rough edges, for example a flat bar with zero volume on 29 June 2026, and we left them as they were.
Running it
- Sign in at crohamhurst.app and open the dashboard.
- Choose Cycle scanner in the sidebar.
- Paste the closes into the box, one per line or comma separated.
- Leave the defaults (minimum period 5, maximum 250, five cycles, linear detrend) and press Scan cycles.
The Hurst gauge sits at the top of the result. The run used 3 compute units. The same scan also gives the FFT cycle table, which our guide to FFT, Hurst and Bartels covers, so here we stay on the exponent.
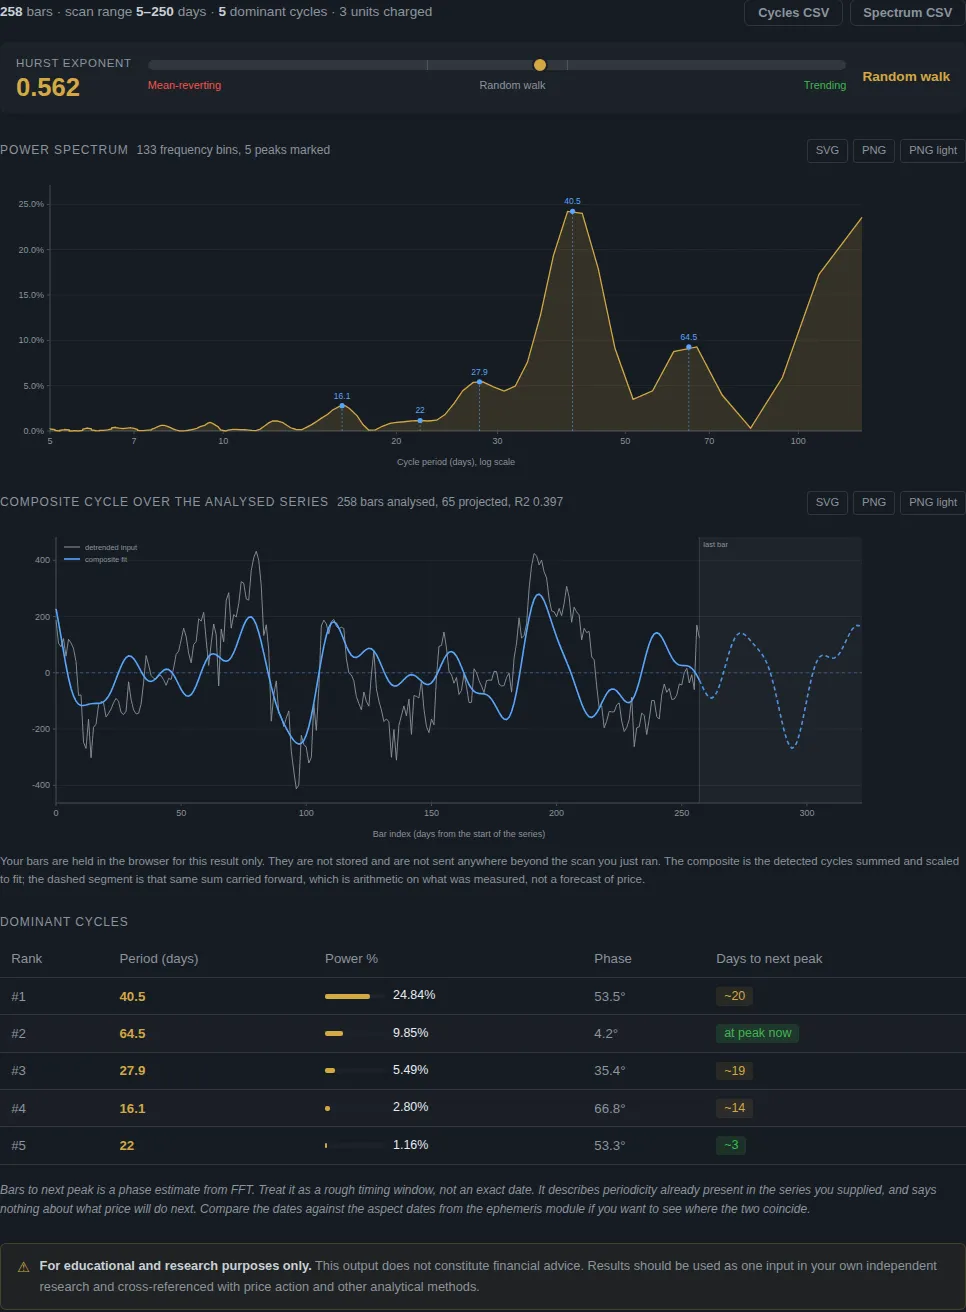
The result: 0.562
The gauge reads 0.562 and the label is random walk, because the value falls between 0.4 and 0.6.
How should you read a number like that? Not as "0.062 above a coin toss, so there is a trend". The scanner's source records a check done on simulated data: a plain random walk came out at about 0.55, and a strongly mean-reverting series at about 0.2. R/S analysis reads a little high on short samples, so a random walk does not land on exactly 0.5. A reading of 0.562 sits almost exactly where a simulated random walk sits.
So the plain-language result is: over this window, the ASX 200 behaved very much like a random walk on this measure. That is a real finding about this stretch of data. It is not a finding about every index or every year.
How stable is one reading?
A good habit with any statistic is to move the window and see whether the answer holds. We split the 258 closes in two, 129 each, and ran each half separately.
| Window | Closes | H | App label |
|---|---|---|---|
| Whole window, 3 Nov 2025 to 6 Nov 2026 | 258 | 0.562 | random walk |
| First half, 3 Nov 2025 to 8 May 2026 | 129 | 0.624 | trending |
| Second half, 11 May to 6 Nov 2026 | 129 | 0.554 | random walk |
The first half crossed the 0.6 line and was labelled trending. The second half and the whole window were not. Same index, same year, and the label changed.
That does not make the Hurst exponent useless. It tells you something honest about it: with only 129 to 258 bars, the estimate moves enough to cross a label boundary. The half-year windows also use fewer block sizes in the fit (four, against five for the whole window), which makes each estimate rougher. If you want a firm reading you need more data, and you need to check that the answer survives different windows.
What a reading near 0.5 does and does not tell you
It does tell you that, on this measure, past moves in the window gave little help in guessing the next stretch. A strategy that depends on trends continuing, or on moves snapping back, has no support from this particular number over this particular window. That is useful to know before you build anything on it.
It does not tell you that the market is unknowable, or that other methods fail. Hurst looks at one thing, serial persistence in returns. Calendar effects, cycles, levels and event timing are different questions, and each has to be tested on its own terms. The point of a tool like this is that any such idea can be put against chance before money goes near it.
It does not tell you what happens next. A Hurst value describes the data you gave it. It is not a signal for next week.
Using the exponent sensibly
- Use more data. A few hundred bars is a rough guide. A few thousand is better. The app accepts up to 2,048 closes per scan.
- Split and compare. If the label flips between halves, treat the reading as unsettled, as ours did.
- Compare instruments. Run the same window on the S&P 500 and the ASX 200 and see whether they differ by more than the half-to-half wobble above.
- Pair it with a significance check. For cycles, our post on the Bartels test shows how to ask whether a cycle is likely to be real. For the cycle table from the same ASX 200 scan, see the ASX 200 FFT walkthrough.
Questions people ask
What is a good Hurst exponent? There is no good or bad value. Above 0.6 suggests trending behaviour, below 0.4 suggests mean-reverting behaviour, and about 0.5 suggests a random walk. Which one suits you depends on the strategy you are testing.
Does a Hurst exponent of 0.56 mean the market trends? Not by itself. A simulated random walk reads about 0.55 in the scanner, so 0.56 is within that range, and our own half-window checks moved by 0.07.
Why does the app use returns instead of prices? R/S analysis assumes roughly stationary increments. On price levels it pins near 1.0 for nearly any random walk, which is why the scanner works on log returns.
How many compute units does it use? About one unit per 100 bars, so 3 units for our 258 closes. See the Cycle Scanner guide.
Try it yourself
Paste your own closes into the Cycle Scanner at crohamhurst.app and read the Cycle Scanner guide for every setting. Run your favourite market on two different windows, and see whether the label holds.
This is research and education, not financial advice.
Crohamhurst computes the Square of Nine, Bradley siderograph, planetary ephemeris, cycle scans and historical analogs from your own price data, in your browser. Plans start at $49 a month.
Create an account