FFT Cycle Analysis in 5 Minutes: Finding the Dominant Cycle in the ASX 200
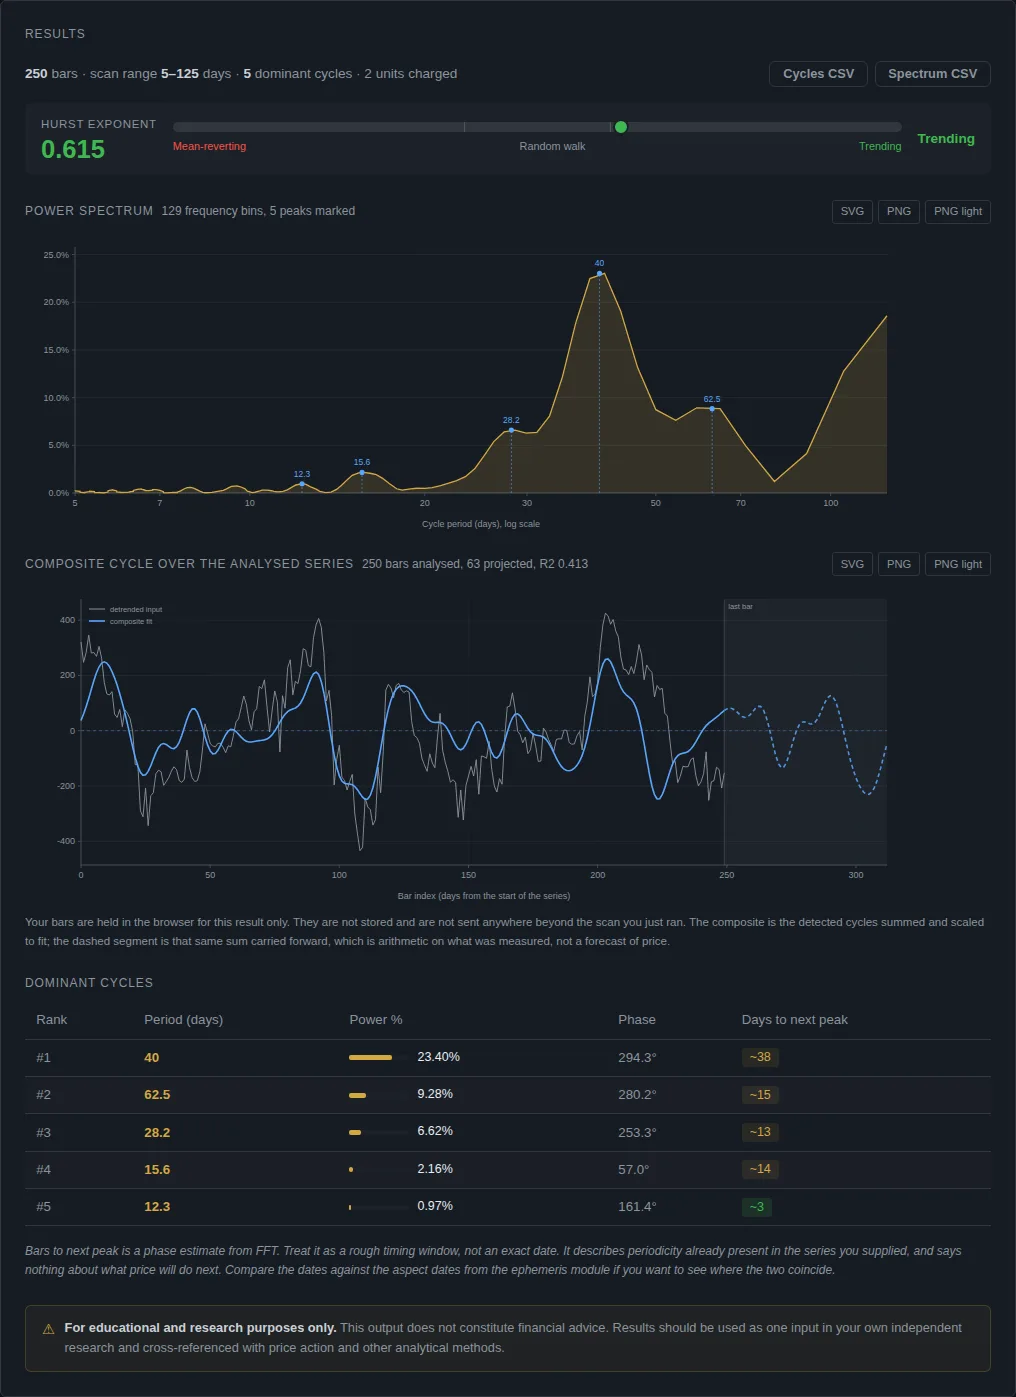
FFT cycle analysis breaks a price series into repeating cycles and ranks them by how much of the movement each explains. We ran it on 250 daily closes of the ASX 200 (16 October 2025 to 9 October 2026). The strongest cycle is 40 days long and carries 23.4% of the power. The Hurst exponent is 0.615, which the app labels trending.
What the Cycle Scanner does
The scanner runs a fast Fourier transform (FFT) on your prices after removing the trend. The FFT finds the repeating wave lengths, in days, that best explain the movements. It reports the five strongest, how much of the signal each carries, and a Hurst exponent. The Hurst exponent measures whether moves tend to continue (above 0.6), reverse (below 0.4) or look random in between. Our guide explains the method in detail.
Step by step
It costs 2 compute units. We paste the closes in rather than loading them from the instrument list, because loading history by instrument is a Pro feature. Any plan can paste its own data.
- Download the closes. We used Yahoo Finance, ticker ^AXJO, the last 250 daily closes to 9 October 2026. You can copy them from the file we saved with this post, asx200-250-closes.txt.
- Sign in at crohamhurst.app and open the dashboard.
- Choose Cycle scanner.
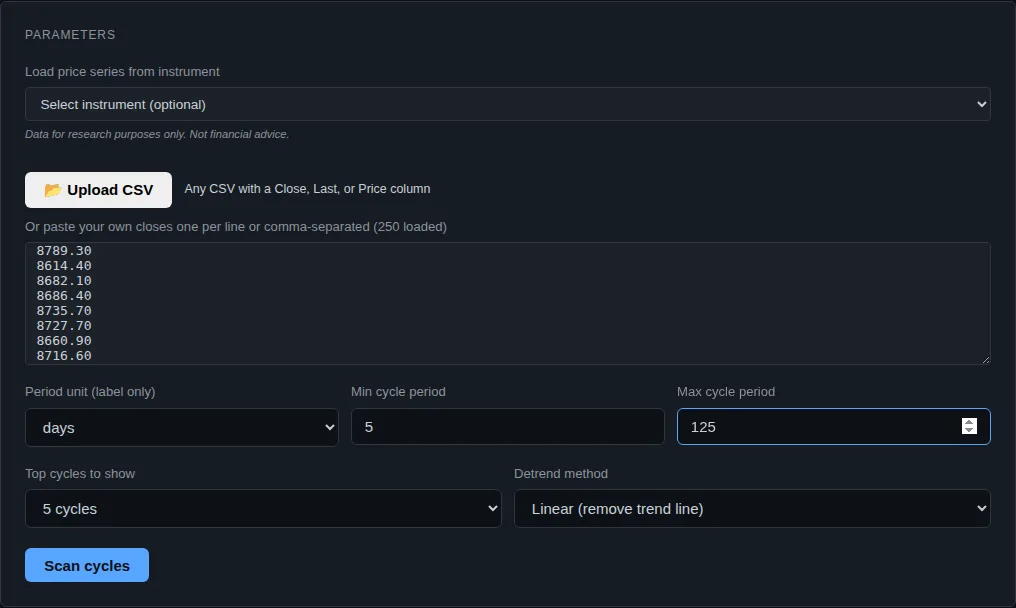
- Paste the 250 closes into the box, one per line.
- Set Min cycle period to 5 and Max cycle period to 125, which is half the length of the series. Cycles longer than half your data cannot be seen reliably. Leave 5 cycles and linear detrend.
- Press Scan cycles.
Reading the result
| Rank | Period (days) | Power |
|---|---|---|
| 1 | 40 | 23.40% |
| 2 | 62.5 | 9.28% |
| 3 | 28.2 | 6.62% |
| 4 | 15.6 | 2.16% |
| 5 | 12.3 | 0.97% |
Three things to read.
- Period and power. A 40 day cycle explains 23.4% of the detrended signal. The next is a 62.5 day cycle at 9.28%. After the third the power is small.
- Composite fit. The five cycles summed explain 41.3% of the variance in the series (R squared 0.413). The dashed line in the chart carries that sum forward 63 bars. That is arithmetic on what was measured, not a forecast.
- Hurst exponent. 0.615 is just above the 0.6 line for trending. One number from 250 bars is a rough guide, not a verdict.
The table also gives "days to next peak" for each cycle (about 38 days for the 40 day cycle). It is a phase estimate. Treat it as a rough window.
The important caution
An FFT will always return peaks, even on random data. A 40 day cycle in a 250 day series repeats only about six times. That is not many. Before you trust a cycle you need a significance test. Ours is the Bartels test, explained in our post on Bartels cycle significance. We have not run it on this series for this post, so we do not claim this 40 day cycle is real.
What to do next
Change the window and see if the 40 day cycle survives. Run the same scan on the first 125 closes and the last 125. If the dominant period moves a lot, it is not stable. Then compare the cycle dates with your own chart.
Common mistakes
- Using too few bars. With 60 bars you cannot find a 40 day cycle. Keep the maximum period at about half the series length.
- Skipping the detrend. A trending series puts most of the power in the longest period. The app removes a straight line by default. Use the difference option for series that curve strongly.
- Reading projected peaks as dates to trade. The projection is the same cycles carried forward. If the cycle is not real, the projection is not either.
- Pasting prices with gaps. Public holidays and missing rows shift the period lengths. Use a clean daily series.
What this does not tell you
The scanner describes repetition that already happened in the data you gave it. It does not say the cycle will continue, and it cannot tell you what price will do next.
Questions people ask
How do I find the dominant cycle in a stock index? Detrend the prices, run an FFT and read the period with the highest power. The app does that when you paste the closes and press scan.
What is the Hurst exponent? A number that describes whether a series tends to trend (above 0.6), mean revert (below 0.4) or behave randomly. The app calculates it on log returns, not raw prices.
How many price bars do I need? More is better. We used 250. A cycle needs to repeat several times to be believable, so keep the maximum period well below half the length.
Does it cost anything? Two compute units for this run, from the Free plan's 50 a day. See the Cycle Scanner guide.
General information only. This is not financial advice. Past patterns do not guarantee future results. Consider your own circumstances, or speak to a licensed financial adviser, before making any investment decision.
Crohamhurst computes the Square of Nine, Bradley siderograph, planetary ephemeris, cycle scans and historical analogs from your own price data, in your browser. The free plan needs no card.
Create free account