Gann Square of Nine Gold Levels for 2026, Scored in Public
We ran the Gann Square of Nine on gold using the 30 June 2026 swing low of 3955.40 as the anchor. The cardinal levels nearest today's price are 4096.00, 4160.25, 4225.00 and 4290.25. We are writing down the claim today, 11 October 2026, and will score it on 30 November. This is a test of a method, not trading advice.
Where the numbers come from
All prices below are from Yahoo Finance, ticker GC=F, which is the gold futures continuous series, pulled on 11 October 2026. It is the same feed the app uses for its live prices.
- Anchor: 3955.40, the lowest daily low since the start of May 2026, on 30 June 2026 (the series shows 3955.3999).
- Last close: 4216.30 on 9 October 2026.
We chose the swing low as the anchor because the method is usually taught from a significant high or low. Nobody agrees on what counts as "significant", and we say plainly that we picked it by eye from the chart.
How the Square of Nine turns a price into levels
The Square of Nine is a spiral of numbers, 1 in the middle and 2, 3, 4 and so on winding outwards. Gann's idea was that prices which sit on the same angle of the spiral are related.
The maths is short. The app takes the square root of your anchor price (62.89 for 3955.40) and uses it to place the anchor on the spiral, at 340.6 degrees. It then works out which ring that falls in, and lists the grid levels for that ring, one ring below it and the number of rings above it that you asked for. Each level is the square of 1 plus 2 times the ring number plus the angle divided by 180. At a 45 degree step that gives one level every 0.25 of square root.
The cardinal levels, the ones the app calls strongest, are the squares of whole numbers and half numbers: 64 squared is 4096.00, 64.5 squared is 4160.25, 65 squared is 4225.00, 65.5 squared is 4290.25. The diagonal levels sit between them at 0.25 steps.
One thing we found while preparing this post, and you should know it. The levels sit on a fixed grid. They are squares of multiples of 0.25 and do not depend on the anchor you choose. The anchor picks which part of the grid is shown, and where your price sits on the spiral (3955.40 is at 340.6 degrees). If you use a different anchor you get the same price levels, just a different window of them. The grid does not move with your swing point.
That matters for judging the method. A level near today's price is not a prediction from the June low in any special way. It is a level the grid has at that price regardless.
Step by step: reproduce it
This costs 1 compute unit.
- Create a free account at crohamhurst.app and open the dashboard.
- Choose Gann Square of Nine.
- In the anchor price box enter 3955.40. Leave the step at 45 degrees and the rings at their default.
- Press Run Square of Nine.
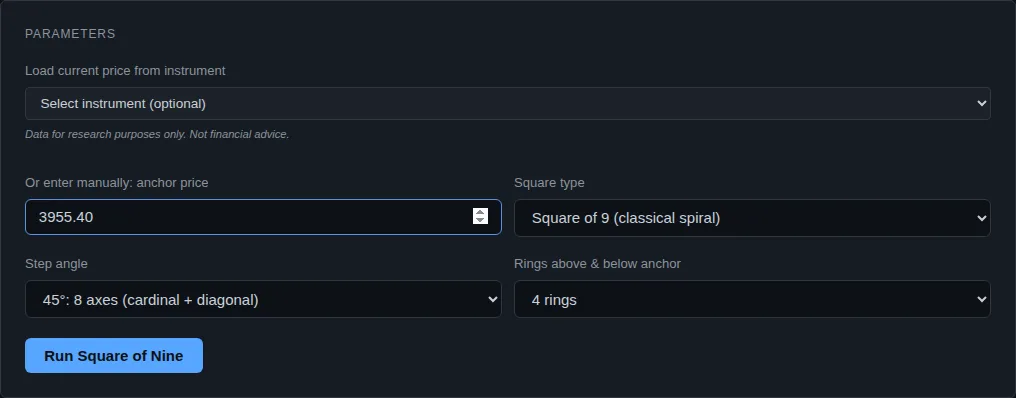
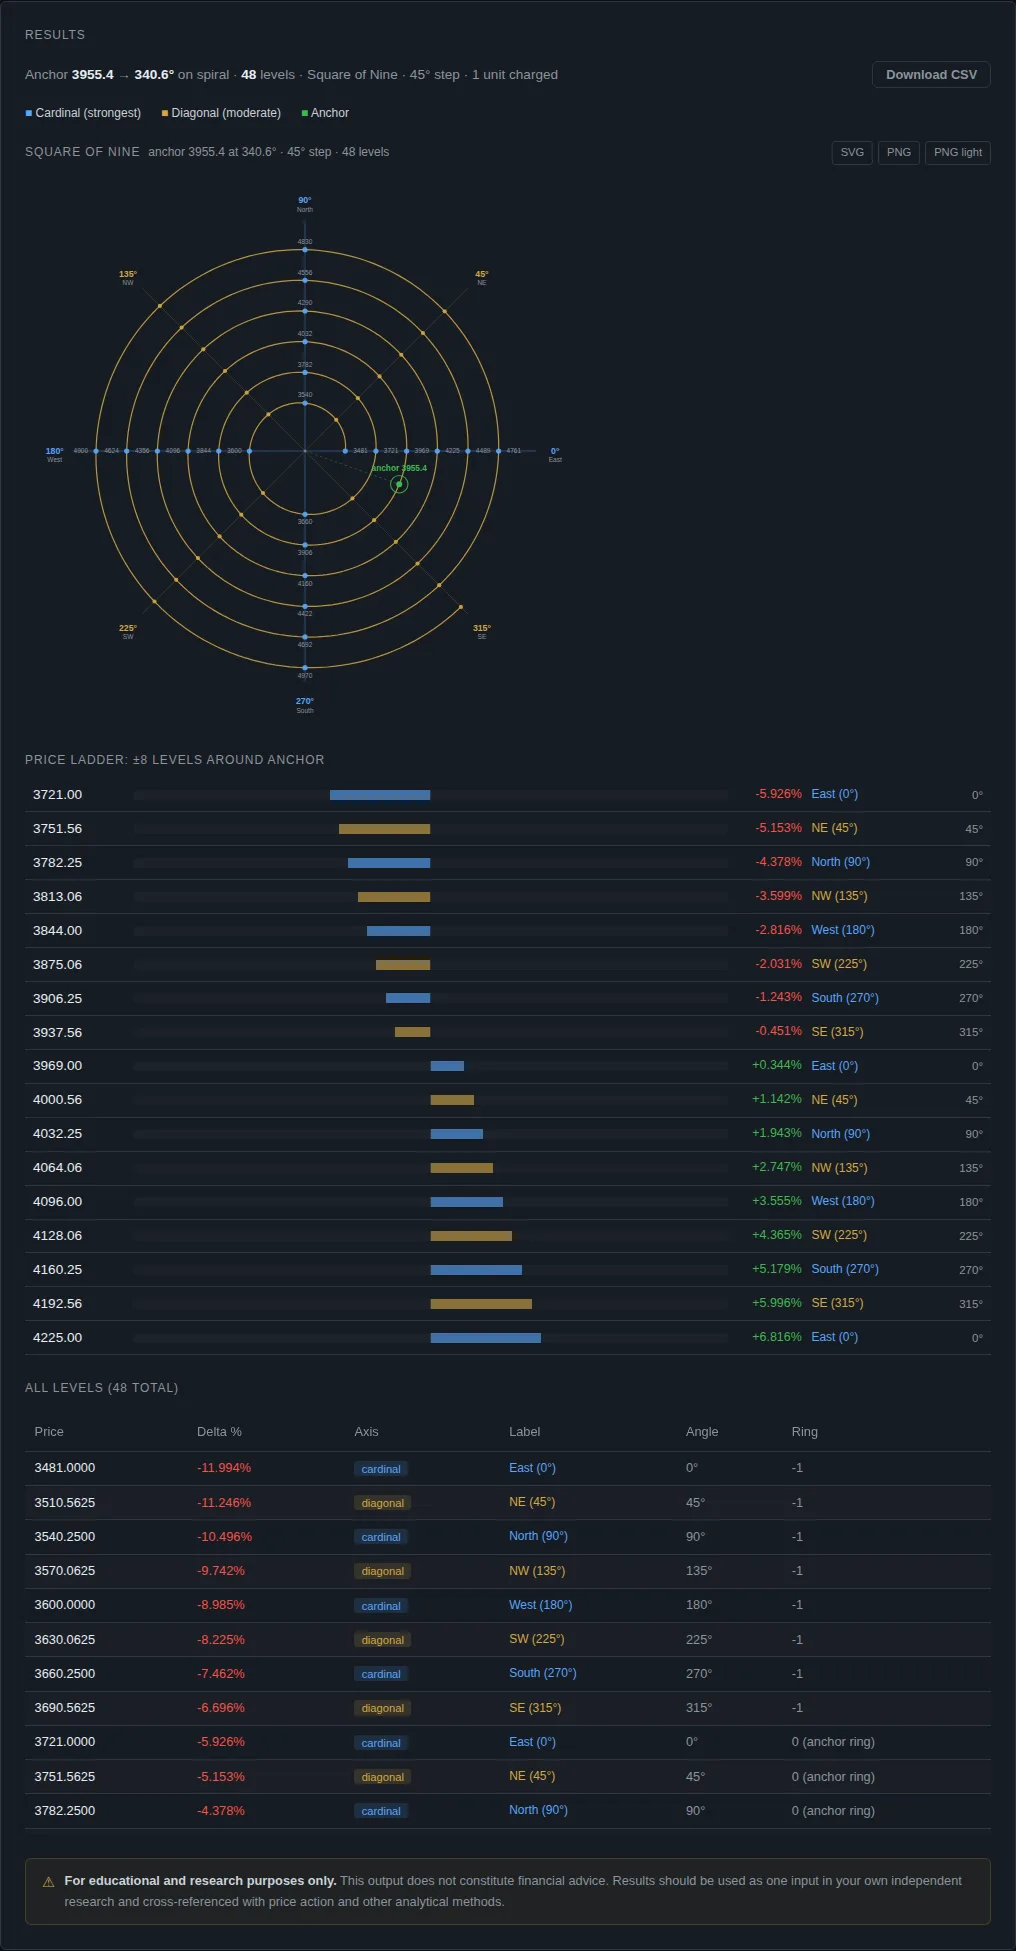
Here are the cardinal levels the app returned, with the distance from the 3955.40 anchor.
| Level | Axis | Distance from anchor |
|---|---|---|
| 3969.00 | East | +0.34% |
| 4032.25 | North | +1.94% |
| 4096.00 | West | +3.56% |
| 4160.25 | South | +5.18% |
| 4225.00 | East | +6.82% |
| 4290.25 | North | +8.47% |
| 4356.00 | West | +10.13% |
| 4422.25 | South | +11.80% |
Gold closed at 4216.30 on 9 October. That is 0.2% below the 4225.00 level. We know that looks tidy. It is a coincidence of where the price happened to sit when we ran this, and we have not adjusted anything to produce it.
The call, and how we will score it
Window: 12 October to 27 November 2026 (inclusive), using daily bars from Yahoo GC=F.
Claim: both of the following will be true.
- The lowest daily low in the window falls within 0.25% of one of the cardinal levels.
- The highest daily high in the window falls within 0.25% of one of the cardinal levels.
The cardinal list is every cardinal level on the full grid, not only the eight in the table above, in case price leaves the range shown. Diagonal levels do not count.
Resolution date: 30 November 2026. We pull the series fresh that day. Because GC=F is a continuous futures series, a contract roll inside the window can create a gap. We will score the series exactly as Yahoo serves it on 30 November and say so on the scorecard if a roll affects the result.
Chance baseline: near 4,200 a band of 0.25% either side is about 21 points wide. Cardinal levels are about 65 points apart, so a random price lands inside a band about 32% of the time. For both the low and the high to land inside bands by luck is about 10% (0.32 times 0.32).
How we score it:
- Both land in a band: a hit, with a 10% chance of happening by luck.
- One lands: a half hit, which is what luck gives you about 44% of the time. We count it as no evidence.
- Neither lands: a miss, and the most likely outcome by luck (about 46%).
One result cannot validate the method either way. Gold may also move well outside the ladder shown. We will report it on the scorecard with the misses.
What this does not tell you
Price levels from a spiral do not say whether gold goes up or down. They give places where we will look for a reaction and score whether one appeared. They are no use as entries or exits on their own, and nobody should treat them that way.
If you only want the numbers for your own anchor, our free Square of Nine calculator does it without an account. For a plain explanation of the method see the Square of Nine guide and the in-app how-to.
Questions people ask
What is the Gann Square of Nine used for? Traders use it to list prices that share an angle on a number spiral and then watch whether the market reacts near them. Whether that works better than chance is exactly what this post sets out to test.
Can I use it on gold? Yes. Enter any positive price. We used the swing low of 3955.40.
Does the anchor change the levels? Not the grid. The levels are squares of multiples of 0.25 for any anchor. The anchor changes which window of the grid you see.
Which gold price did you use? Yahoo Finance GC=F, the continuous futures series, daily bars, pulled on 11 October 2026.
General information only. This is not financial advice. Past patterns do not guarantee future results. Consider your own circumstances, or speak to a licensed financial adviser, before making any investment decision.
Crohamhurst computes the Square of Nine, Bradley siderograph, planetary ephemeris, cycle scans and historical analogs from your own price data, in your browser. The free plan needs no card.
Create free account