Bradley Siderograph 2026: S&P 500 Turn Dates, Called in Advance
The Bradley siderograph for 12 October to 7 December 2026 gives seven turning dates: lows on 18 Oct, 29 Oct, 18 Nov and 5 Dec, and highs on 21 Oct, 5 Nov and 26 Nov. We are publishing them today, 11 October 2026, with the rule we will use to score them against the S&P 500. This is a test of a method, not trading advice.
What the Bradley siderograph is
The Bradley model adds up the angles between planets into one curve. The curve is then read for its local highs and lows. Donald Bradley published the formula in 1948. It is P = X × (L + D) + M, where L is a set of long-term aspect terms, M is a set of middle-term terms, D is a declination term, and X is a weighting (4 in the classic version, which the app uses). If you want the full history and the maths, our complete guide to the Bradley siderograph covers it.
The claim made for the curve is that its turning points cluster near turning points in markets. We want to find out whether that is true, in public, with the misses showing.
The honest starting point: a calibration run
Before making a forward call we ran the same method backwards. We took the app's turning points from 1 January 2025 to 9 October 2026 and compared them with S&P 500 closing prices (Yahoo Finance, ticker ^GSPC, pulled 11 October 2026).
A "pivot" in the price series is a daily close that is the highest or lowest close in the 5 trading days either side. A siderograph turn counts as a hit if a pivot of the same type (high or low) falls within 3 calendar days.
The result: 11 of 37 turn dates were hits, which is 29.7%. We then asked how often a random calendar date would be a hit by luck, using the same rule and the same price history. For the same mix of highs and lows, that chance level is 29.6%.
So on the last 21 months of S&P 500 data, the siderograph did no better than picking dates at random. That is the number to hold in your head when you read the rest of this post. A forward call that works would be a surprise to us, and a miss would not be.
Step by step: how to reproduce the call
You can run this yourself on the Free plan. It costs 3 compute units of your daily 50.
- Create a free account at crohamhurst.app and open the dashboard.
- Choose Bradley siderograph in the module list.
- Set Start date to 12 October 2026 and End date to 7 December 2026.
- Leave the planets, orb and formula on their defaults (the classic formula).
- Press Run computation.
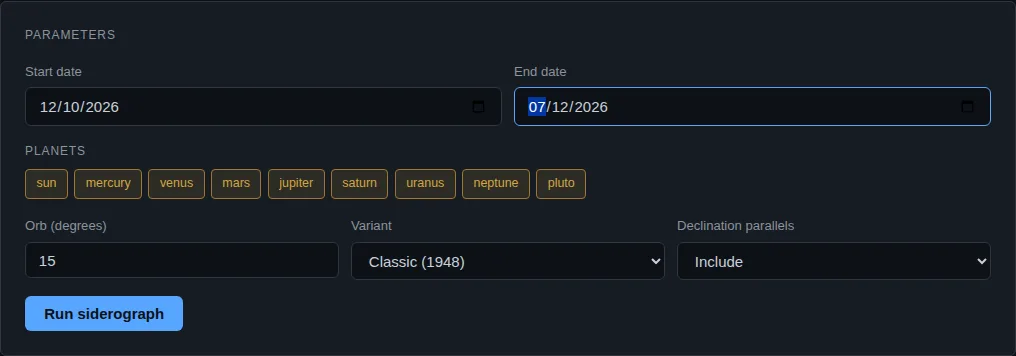
The app returns the curve and a table of turning points. Here is the result we got on 11 October 2026.
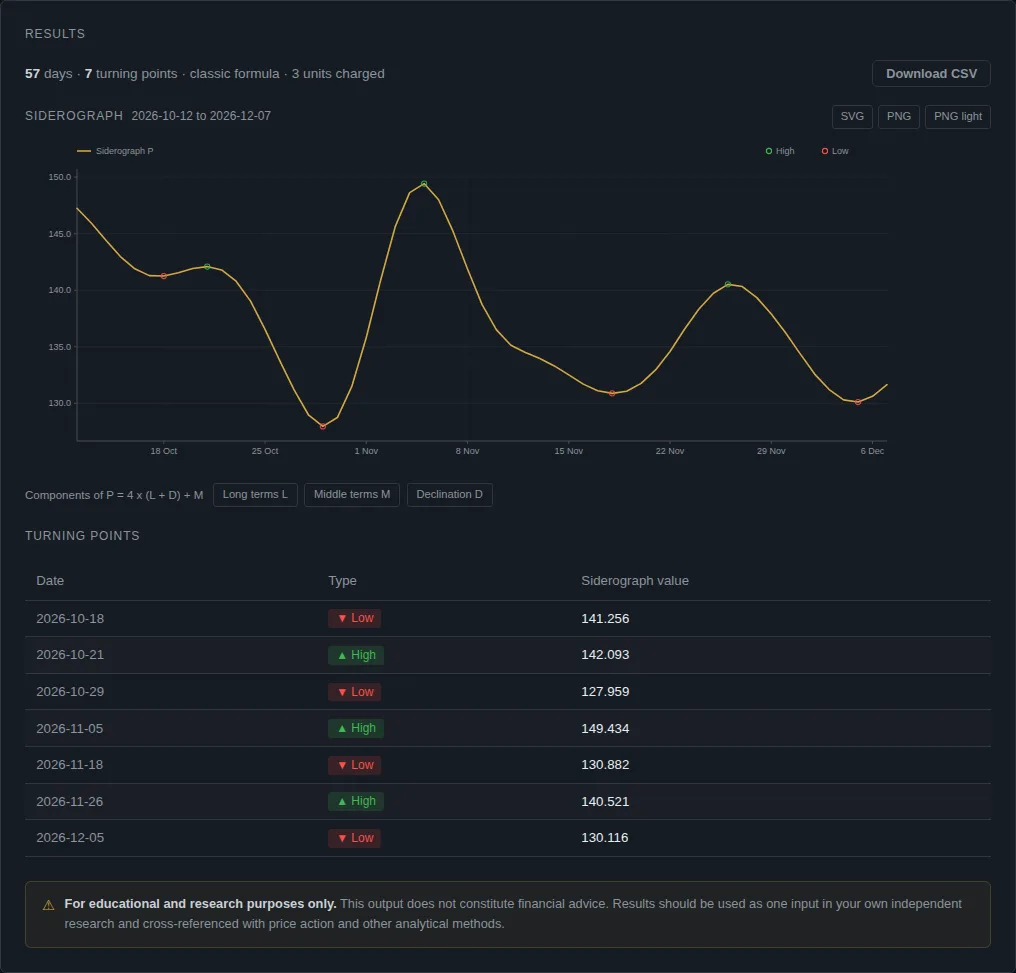
| Date | Type | Siderograph value |
|---|---|---|
| 2026-10-18 | Low | 141.256 |
| 2026-10-21 | High | 142.093 |
| 2026-10-29 | Low | 127.959 |
| 2026-11-05 | High | 149.434 |
| 2026-11-18 | Low | 130.882 |
| 2026-11-26 | High | 140.521 |
| 2026-12-05 | Low | 130.116 |
Two of these are close together. The low on 18 October and the high on 21 October are three days apart and only 0.8 of a point separates them on the curve. Small wiggles like that are what a calibration run penalises, so we kept them in. We did not tidy the table.
The call, and how we will score it
Claim: at least 4 of the 7 dates above will fall within 3 calendar days of an S&P 500 closing pivot of the same type (high or low).
Pivot definition: a daily close in ^GSPC that is the highest (for a high) or lowest (for a low) close in the 5 trading days before and the 5 trading days after.
Resolution date: 18 December 2026. The last pivot needs 5 trading days after 5 December to be confirmed, and Yahoo can revise a close, so we pull the series fresh that day.
Chance baseline: from the calibration, a single date is a hit about 30% of the time by luck. If every date were a coin weighted at 30%, the chance of 4 or more hits out of 7 is about 13% (a binomial calculation, 7 trials at p = 0.30). So 4 of 7 is a result worth noting, though one result of that size would not prove the method works. Three or fewer is what luck produces most of the time.
We will report the result on the scorecard whichever way it falls. A miss stays on the page.
What this does not tell you
The siderograph does not give price direction. It gives dates where a curve changes slope. It has no view on size, on how long a move lasts, or on whether the market is rising or falling into the date. Even a perfect hit rate would not be a trading system.
Our calibration also covers only 21 months of one index. It cannot say anything about the method over decades. If you want to test it properly yourself, our primer on backtesting cycle methods lists the traps, including testing on the same data you tuned on.
Questions people ask
Is the Bradley siderograph accurate? On the 21 months of S&P 500 data we tested, 29.7% of its turn dates matched a price pivot, against 29.6% expected by chance. That is no edge. We will publish the forward result on 18 December 2026.
Can I run it for another market? The siderograph is computed from planetary positions only, so the dates are the same for every market. What changes is the price series you score it against.
How much does it cost to run? Three compute units for a 57-day range. The Free plan has 50 units a day. See the Bradley guide for the full cost table.
Why publish before the dates happen? Because a method shown only after the fact always looks good. Writing the call down first, with the scoring rule, removes the option to pick the winners later.
General information only. This is not financial advice. Past patterns do not guarantee future results. Consider your own circumstances, or speak to a licensed financial adviser, before making any investment decision.
Crohamhurst computes the Square of Nine, Bradley siderograph, planetary ephemeris, cycle scans and historical analogs from your own price data, in your browser. The free plan needs no card.
Create free account