Planetary Analogs and Rainfall: A Summer 2026-27 Test for South-East Queensland
We asked the Crohamhurst Historical Analogs module which past dates had planetary positions closest to 11 October 2026. It returned ten, from 1966 to 2024. Their summers had a median Beerburrum rainfall of 281 mm for November to January, against 397 mm for all complete summers since 1898. So the call is: below 397 mm. We also ran the same rule back to 1966, and it picked the right direction only 46% of the time. This is a test of a method, not a weather forecast.
Why we are doing this
Crohamhurst Observatory stands in the Sunshine Coast hinterland of Queensland. It is where Inigo Jones studied planetary weather cycles and published long-range Queensland forecasts for decades. Our post on the observatory tells that story. The accuracy of his forecasts has been tested separately by the weather team at dayboro.au, and we leave that question to them.
Our question is narrower. If you match the sky of today to the sky of past dates, do the summers that followed those dates tell you anything about this one? The Historical Analogs module finds the dates. We turn the dates into a number and score it.
Step by step: reproduce the run
It costs 10 compute units, because a 100 year scan is the most expensive setting. A Free account has 50 a day.
- Sign in at crohamhurst.app and open the dashboard.
- Choose Historical analogs.
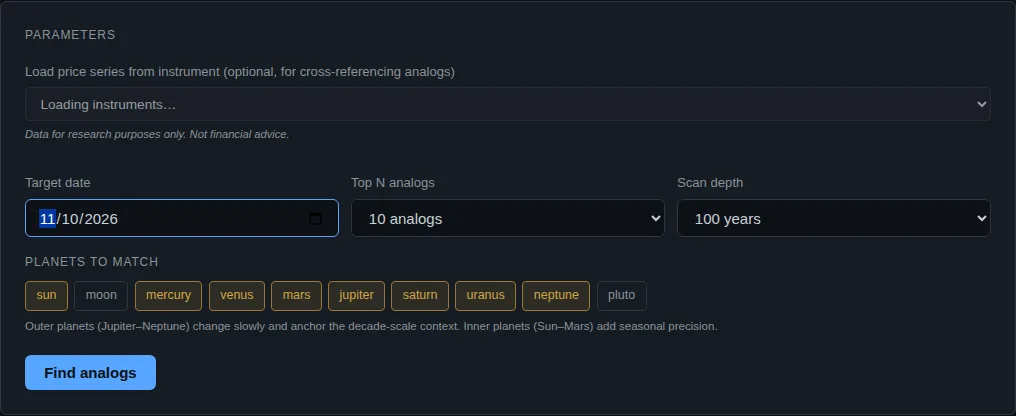
- Set Target date to 11 October 2026. The form does not accept future dates, so today is the latest you can pick.
- Set Top N analogs to 10 and Scan depth to 100 years.
- Leave the planet chips on their defaults (eight planets, Sun to Neptune).
- Press Find analogs. It takes 10 to 30 seconds.
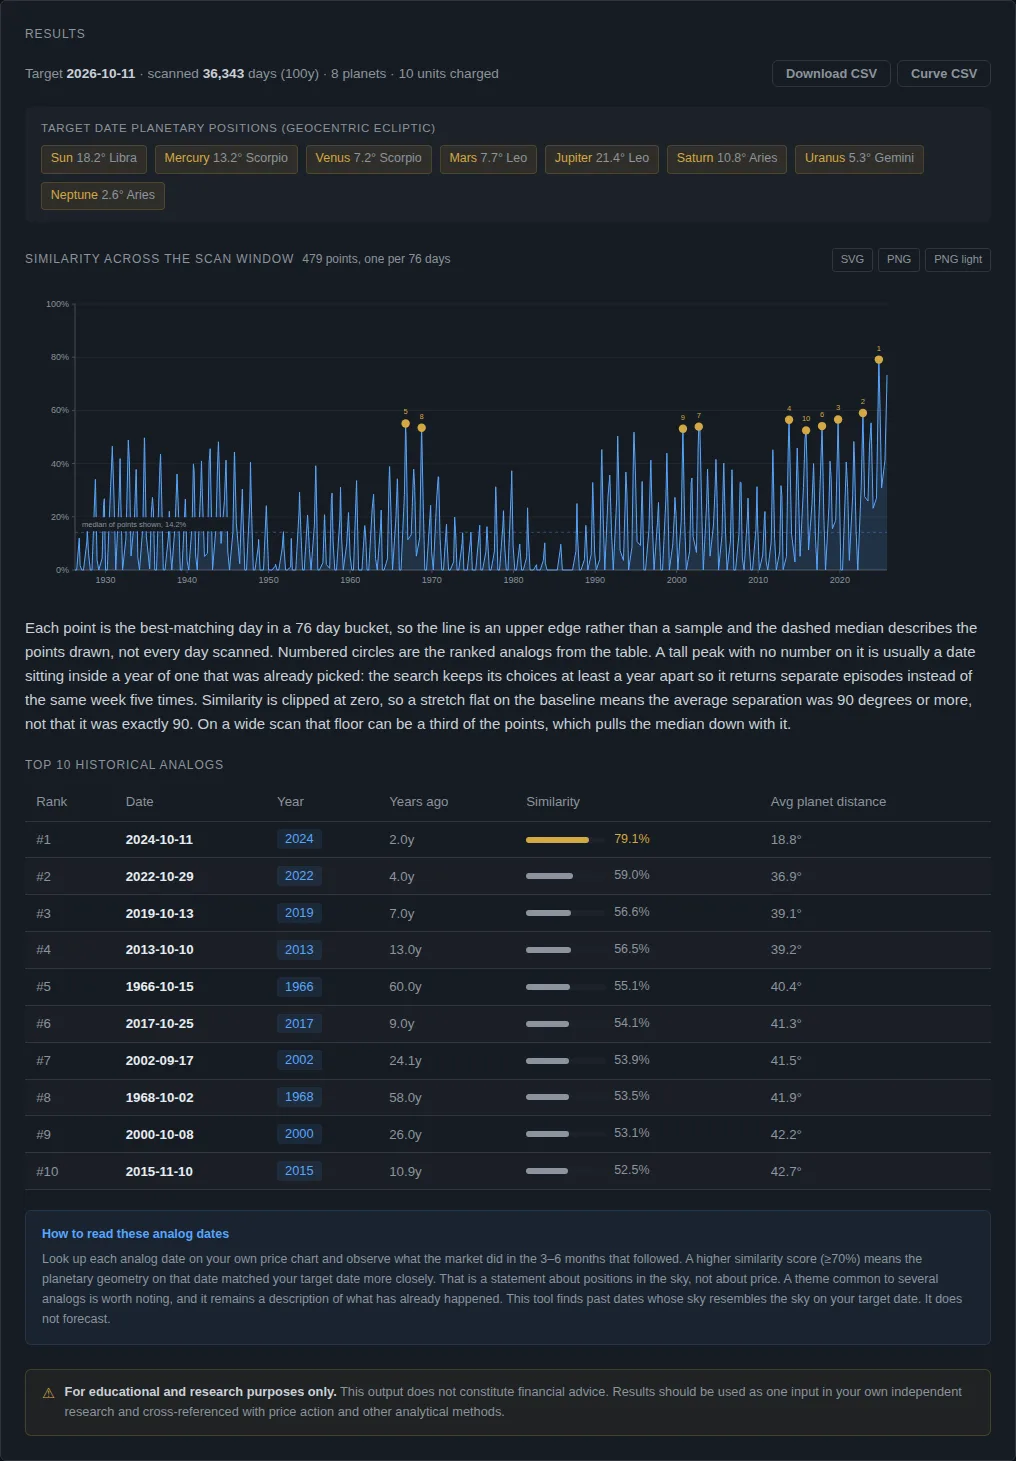
The scan covered 36,343 days. The ten closest dates:
| Rank | Date | Similarity | Average planet distance |
|---|---|---|---|
| 1 | 2024-10-11 | 79.1% | 18.8 degrees |
| 2 | 2022-10-29 | 59.0% | 36.9 degrees |
| 3 | 2019-10-13 | 56.6% | 39.1 degrees |
| 4 | 2013-10-10 | 56.5% | 39.2 degrees |
| 5 | 1966-10-15 | 55.1% | 40.4 degrees |
| 6 | 2017-10-25 | 54.1% | 41.3 degrees |
| 7 | 2002-09-17 | 53.9% | 41.5 degrees |
| 8 | 1968-10-02 | 53.5% | 41.9 degrees |
| 9 | 2000-10-08 | 53.1% | 42.2 degrees |
| 10 | 2015-11-10 | 52.5% | 42.7 degrees |
Only the first date is a close match. The rest sit about 40 degrees away on average per planet, which is not very close. The app says this on the chart. Similarity is a statement about planet positions, not about weather.
From dates to a number
The rainfall data is NOAA GHCN-Daily, station ASN00040284, Beerburrum Forest Station (latitude -26.9586, longitude 152.9619, about 30 km north-north-east of Dayboro, by our calculation). Daily precipitation is summed for November to January, called a summer season and labelled by the November year.
A season counts only if the station has at least 88 of the 92 days. That gives 73 complete summers from 1898 to 2025. The 2024 summer is not complete, so the first analog drops out.
Here are the other nine analog summers, with the November-to-January total at Beerburrum:
| Analog date | Summer total (mm) |
|---|---|
| 2022-10-29 | 256.6 |
| 2019-10-13 | 282.6 |
| 2013-10-10 | 227.8 |
| 1966-10-15 | 522.9 |
| 2017-10-25 | 405.4 |
| 2002-09-17 | 314.1 |
| 1968-10-02 | 281.2 |
| 2000-10-08 | 228.5 |
| 2015-11-10 | 250.2 |
The median of those nine is 281.2 mm. The median of all 73 complete summers is 396.6 mm. Seven of the nine analog summers were below that median.
The call, and how we will score it
Claim: the Beerburrum total for 1 November 2026 to 31 January 2027, from GHCN-Daily station ASN00040284, will be below 396.6 mm, with at least 88 of 92 days reported.
Resolution date: 10 February 2027. GHCN data arrives a few days late, so we pull it that day. If fewer than 88 days are reported, we record "no result" and say so.
Progress note: 15 December 2026, with the total to that date.
Chance baseline: by definition about half of summers are below the median, so luck alone gives 50%.
Does the rule beat that? We ran the identical rule for every year from 1966 to 2025 where enough data existed (57 years). For each year we ran the 100 year analog scan on 11 October using only dates at least a year earlier, took the median rainfall of the analog summers, and compared it with the median of all earlier summers. The rule predicted the right side of the median in 26 of 57 years, which is 45.6%. That is no better than a coin flip. Its average miss was 193 mm, against 185 mm if we had simply guessed the long-run median every year.
So the honest reading is this. The method showed no skill over the last 60 years of Beerburrum data. The forward call is published to see if that changes, and we expect a coin flip.
What this does not tell you
It is not a forecast. It says nothing about how much rain falls on any day, or about floods or fire risk. A nine-summer median hides huge spread: the nine totals run from 228 to 523 mm.
Questions people ask
Can planetary positions predict rainfall? In our test of 57 years at Beerburrum, the analog rule picked the right side of the median 46% of the time, no better than chance.
Where does the rainfall data come from? NOAA GHCN-Daily, station ASN00040284, Beerburrum Forest Station, daily precipitation summed for November to January.
Why Beerburrum? It has a long record in our climate store, from 1898, and sits in south-east Queensland, not far from Crohamhurst. It is not the same as rain at your block.
Where will the result appear? On the forecast scorecard, with the other calls, misses included.
How do I run my own analogs? Use the Historical Analogs guide or our earlier post on rainfall analogs.
General information only. This is not financial advice. Past patterns do not guarantee future results. Consider your own circumstances, or speak to a licensed financial adviser, before making any investment decision. Nothing here is a weather forecast, so do not use it to plan around flood or fire risk. Use the Bureau of Meteorology for that.
Crohamhurst computes the Square of Nine, Bradley siderograph, planetary ephemeris, cycle scans and historical analogs from your own price data, in your browser. The free plan needs no card.
Create free account