Gold Price Cycle Analysis: Finding the Dominant Cycle with an FFT
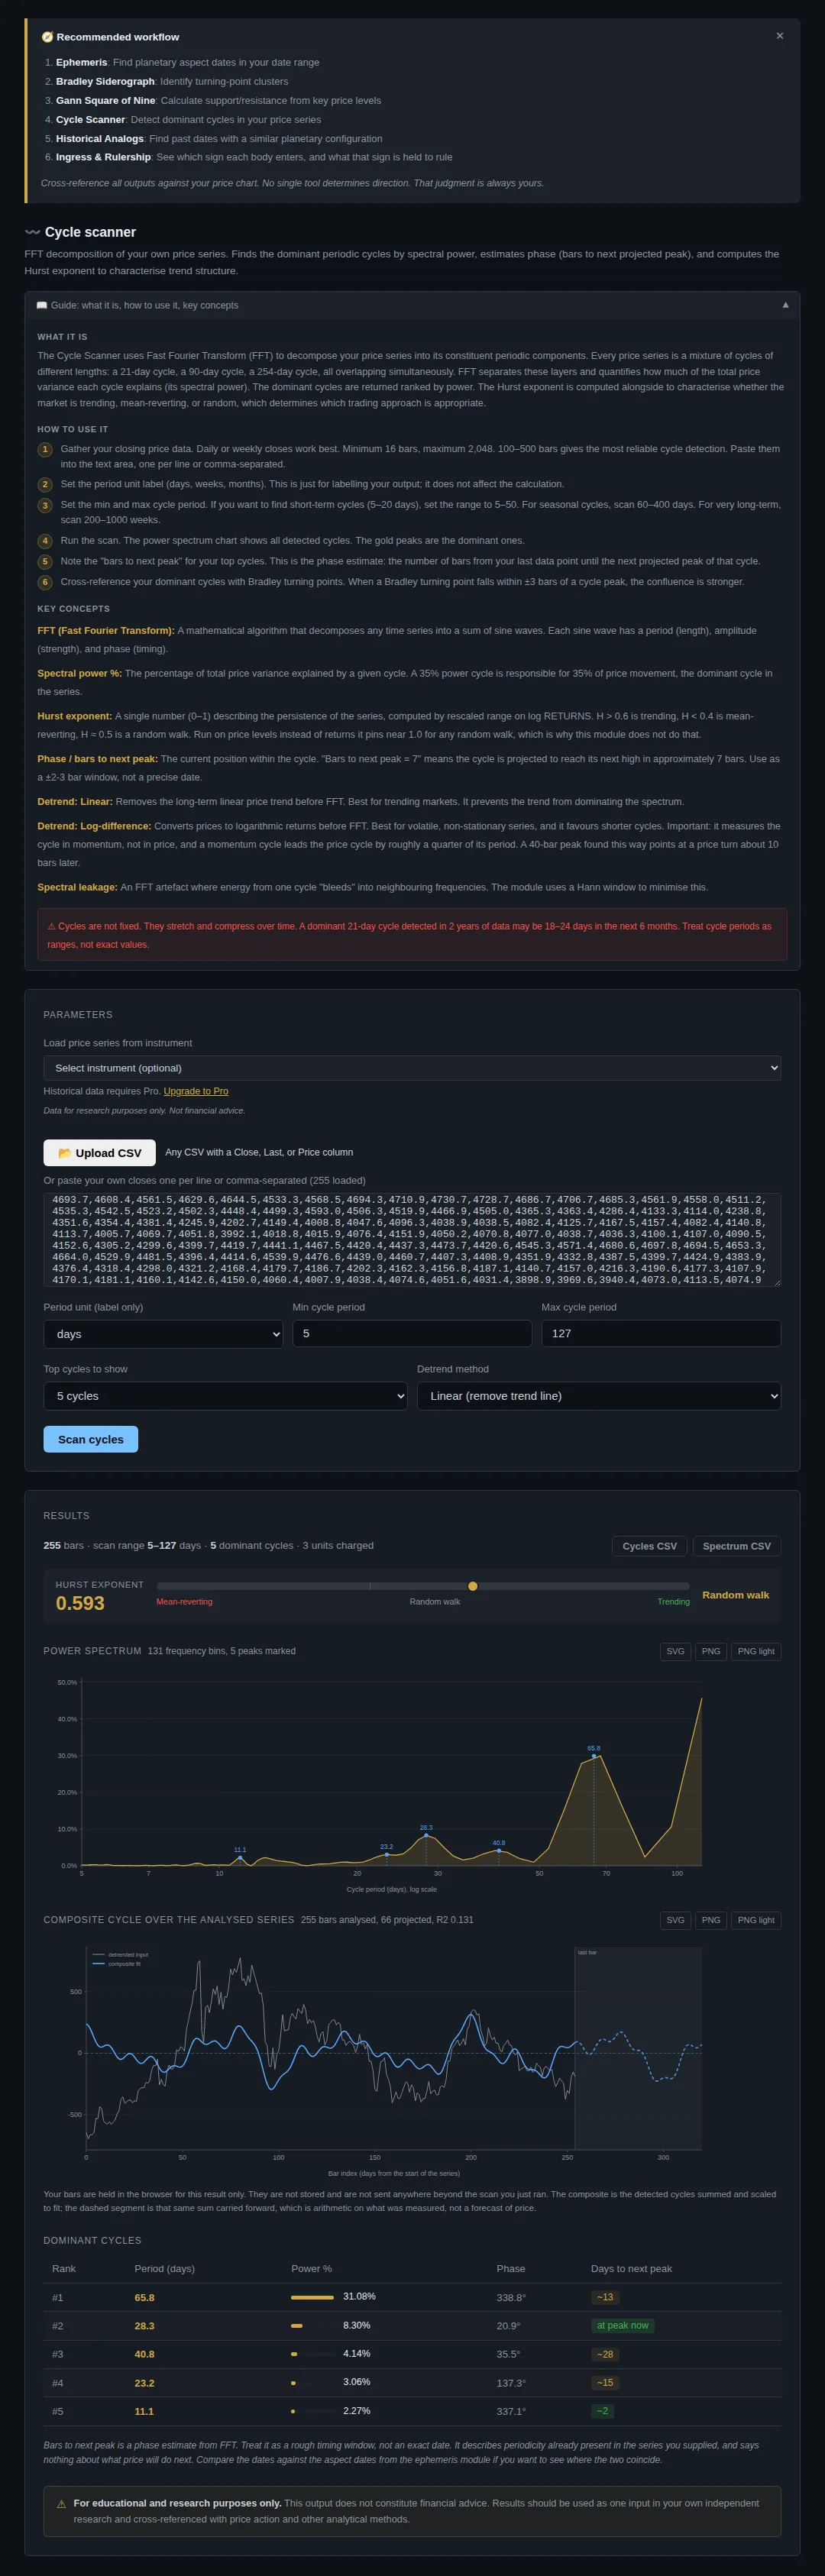
Gold is a good test case for cycle analysis because it has had a big year: a run from about 4,000 to 5,318 and back. We pasted 255 daily gold closes into the Cycle Scanner (ticker GC=F, 3 November 2025 to 6 November 2026). In a few seconds it found a dominant cycle of 65.8 days carrying 31.08% of the in-band power, and a Hurst exponent of 0.593. Here is how to read that, and where to stop.
What the scanner does well
Finding a cycle by eye is slow and easy to fool yourself with. The scanner does the mechanical part exactly. It removes the straight-line trend, applies a window to limit leakage, runs a fast Fourier transform (FFT) and ranks the repeating wave lengths by how much of the movement each carries. It also calculates a Hurst exponent on the log returns. The whole thing took three compute units, from the 50 a day on the Starter plan.
That is the value: a clean, repeatable measurement of the cycles in a series, in seconds, that anyone can rerun on the same data and get the same answer. What the measurement means is a separate question, and we get to it below.
The data
We used the daily closes of gold futures (GC=F) from Yahoo Finance: 255 closes from 3 November 2025 to 6 November 2026, fetched on 10 November 2026. Over that window gold closed at 4,014.0 on the first day and 4,074.9 on the last, a gain of 1.5%. In between it peaked at a close of 5,318.4 on 29 January 2026 and fell to a close of 3,898.9 on 30 October 2026, a drop of about 26.7% from the peak.
A note on the data: GC=F is a rolling futures contract, so a contract change can add a small step to the series. We pasted the closes as Yahoo supplied them and did not adjust them.
Step by step
- Download the closes for your window. Any source of daily closes works. Pasting your own data is available on every plan.
- Sign in at crohamhurst.app and open the dashboard.
- Choose Cycle scanner in the sidebar.
- Paste the closes into the box, one per line or comma separated.
- Set Min cycle period to 5 and Max cycle period to 127. The ceiling is half the series length, because you cannot reliably resolve a cycle longer than half your data. Leave 5 cycles and linear detrend.
- Press Scan cycles.
The result
| Rank | Period (days) | Power | Bars to next peak |
|---|---|---|---|
| 1 | 65.8 | 31.08% | 13 |
| 2 | 28.3 | 8.30% | 0 |
| 3 | 40.8 | 4.14% | 28 |
| 4 | 23.2 | 3.06% | 15 |
| 5 | 11.1 | 2.27% | 2 |
The periods are in bars, and here a bar is one trading day.
The dominant cycle. A 65.8 day cycle carries 31.08% of the in-band power. That is nearly four times the next one, a 28.3 day cycle at 8.30%. By the numbers, one cycle stands out clearly in this window.
How many repeats. The series is 255 bars long, so a 65.8 day cycle fits in about 3.9 times. That is not many. A cycle you have seen four times is a hint, not an established pattern.
The Hurst exponent. It came out at 0.593. The app labels anything between 0.4 and 0.6 a random walk, so 0.593 sits just under the trending line. One number from 255 bars is a rough guide. It says moves in this window had a mild tendency to continue, and that is all it says.
The composite fit. The five cycles summed explain an R squared of 0.131 of the detrended series. In plain terms, about 13% of the movement in the detrended data is captured by those five waves. The dashed line in the chart carries the composite forward 66 bars. That is arithmetic on what was measured, not a forecast.
Bars to next peak. The table gives a phase estimate for each cycle, for example about 13 bars for the 65.8 day cycle. Treat it as a rough window. The app's own note says so: it describes periodicity already present in the series and says nothing about what price will do next.
A caution about the edge of the chart
Look at the power spectrum in the screenshot. The curve climbs steeply toward the right-hand edge, which is the 127 day limit we set. That is a sign that a good deal of the movement sits in cycles longer than we can resolve with a year of data. Gold's big rise and fall across the window is the likely cause. The linear detrend removes a straight line, but a run up and back down is not a straight line, so slow structure leaks into the longest periods. The 65.8 day peak is real in the sense that the arithmetic found it, but it sits next to a lot of long-period power, and a different window could rank things differently.
Did we test whether the cycle is real?
No. The Cycle Scanner reports the FFT and the Hurst exponent. It does not run a Bartels significance test, so we have no Bartels result for this window and will not invent one. An FFT will always return peaks, even on random data, so on its own a 65.8 day peak does not prove a 65.8 day cycle in gold. Our post on the Bartels test explains how to check whether a cycle is likely to be real before you trust it.
What to do next
- Split the window. Scan the first 127 closes and the last 128 separately. If the dominant period jumps around, it is not stable.
- Change the window. Try 180 closes, then 255, then 400. A real cycle tends to survive. A fitted one usually does not.
- Try the log-difference detrend. It analyses returns, so it suits a series with a big trend. Its phase refers to momentum, which leads the price cycle by roughly a quarter of a period.
- Compare with something else. Our ASX 200 walkthrough shows the same steps on an index, and the guide to FFT, Hurst and Bartels covers the method.
What this does not tell you
It does not tell you that gold will peak in 13 trading days, or that a 65.8 day rhythm will carry on. It describes the year that already happened. A published or measured cycle is an average over the data you gave it, not a signal for next week. What it does give you is a precise, repeatable way to test a cycle idea on real data before any money is involved, and that is worth having.
Questions people ask
What is the dominant cycle in gold? In the 255 closes we tested, 3 November 2025 to 6 November 2026, it was 65.8 days with 31.08% of the power. Another window may give a different answer.
What does a Hurst exponent of 0.593 mean? Moves in this window leaned slightly toward continuing rather than reversing. The app labels it a random walk because it is under 0.6.
How much data do I need? More is better. Keep the maximum period at or below half your series length, and remember a cycle that repeats only a handful of times is weak evidence.
How many compute units does it use? Three for this run, about one per 100 bars. See the Cycle Scanner guide.
Try it yourself
Paste your own closes into the Cycle Scanner at crohamhurst.app, and read the Cycle Scanner guide for every setting. Run it on a window you already know, and see whether the cycle holds up when you move the window.
This is research and education, not financial advice.
Crohamhurst computes the Square of Nine, Bradley siderograph, planetary ephemeris, cycle scans and historical analogs from your own price data, in your browser. Plans start at $49 a month.
Create an account