Bradley Siderograph ASX 200: Turn Dates to February 2027
The Bradley siderograph gives eight turn dates between 12 November 2026 and 12 February 2027: lows on 18 Nov, 5 Dec, 16 Dec and 30 Dec, and highs on 26 Nov, 11 Dec, 18 Dec and 15 Jan. The app computed them in a few seconds from JPL ephemeris positions. Below we list them, then check the nine most recent turn dates against the ASX 200, with the misses shown.
This post is descriptive. It is not a tracked call and we will not score it later. The tracked Bradley call is on the S&P 500 and is already published: see Bradley Siderograph 2026: S&P 500 Turn Dates. The siderograph is built from planetary positions only, so the dates are the same for every market. What changes is the price series you hold them up against. Here that series is the ASX 200.
Why this is quick to do in the app
A Bradley curve adds up weighted aspect terms for every pair of planets, for every day in the range, then adds a declination term. By hand that is a long job. The app does it with the classic 1948 formula, a 15 degree orb, and no Moon, and it marks each local high and low for you. That leaves your time for the part that matters, which is checking the dates against real prices before you give them any weight. If you want the method and the history first, read our complete guide to the Bradley siderograph.
The next three months of turn dates
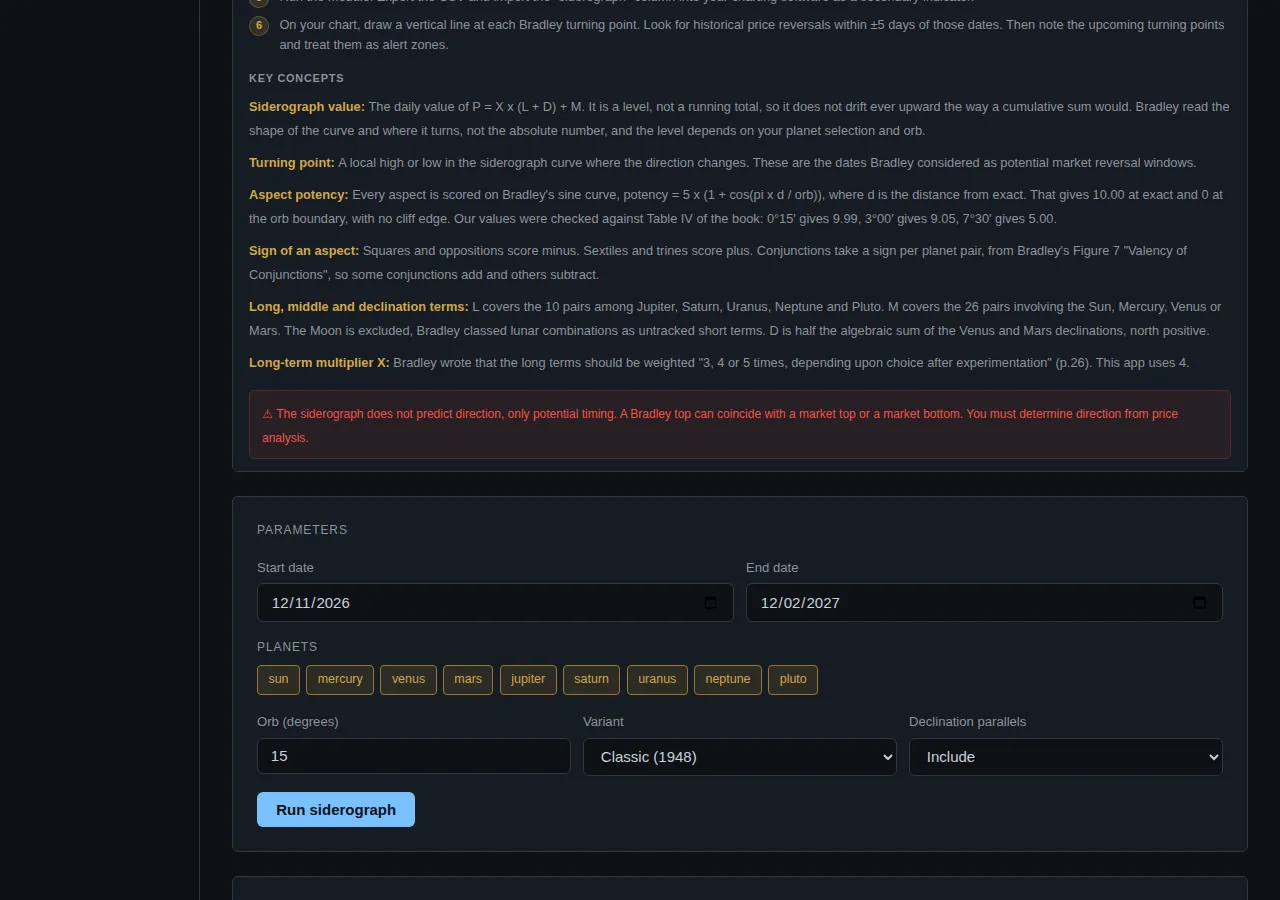
We ran the module for 12 November 2026 to 12 February 2027 on the default settings. A 92 day range costs 1 compute unit of the 50 a day on the Starter plan.
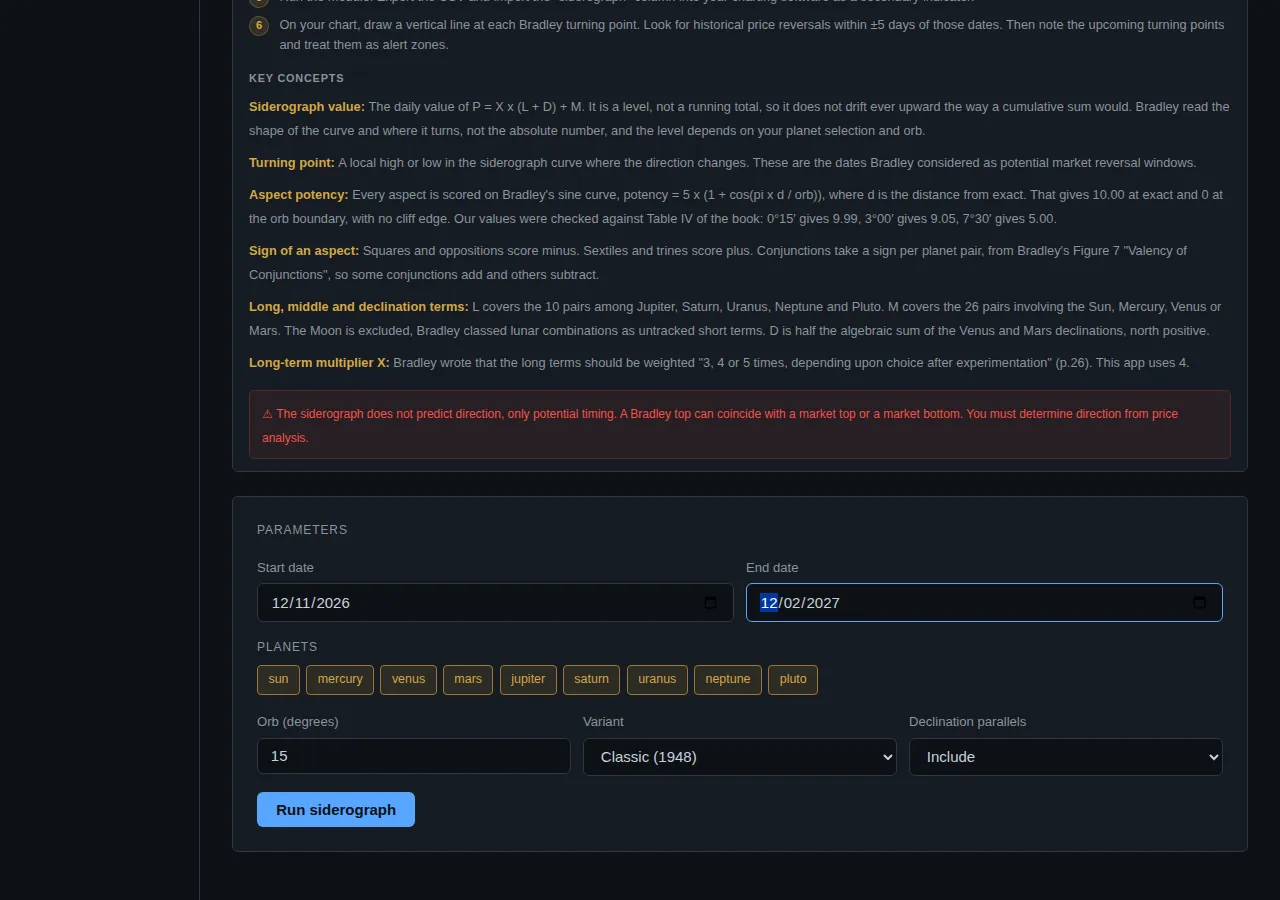
After you press Run siderograph, the curve and the turning point table appear in a panel below the form.
The app returned eight turning points:
| Date | Type | Siderograph value |
|---|---|---|
| 2026-11-18 | Low | 130.88 |
| 2026-11-26 | High | 140.52 |
| 2026-12-05 | Low | 130.12 |
| 2026-12-11 | High | 135.34 |
| 2026-12-16 | Low | 130.99 |
| 2026-12-18 | High | 131.21 |
| 2026-12-30 | Low | 105.42 |
| 2027-01-15 | High | 149.07 |
Three things are worth reading off the table.
- Not all turns are equal. The 16 and 18 December pair are two days apart and only 0.22 of a point separates them. That is a flat stretch with a small wobble, not a clear swing. The move from the 30 December low to the 15 January high is 43.6 points (105.42 to 149.07), against 9.6 points from the 18 November low to the 26 November high. Bradley's idea was that the shape of the curve matters more than the number, so larger swings are the ones to look at first.
- The range ends mid-slide. From the 15 January high the curve falls every day to 71.78 on 12 February. The app does not mark 12 February as a turn because a turn needs a day on each side. Run a longer range to see where it bottoms.
- The first three November and December dates are shared with the S&P 500 call. The 18 Nov, 26 Nov and 5 Dec dates are the same ones in that published call, as they should be, since the inputs are the same.
How the last nine turn dates sat against the ASX 200
Before relying on any timing tool, check it on the past. We ran the same module for 1 January 2025 to 11 November 2026, which returned 44 turning points. Doing every one of those by hand against 493 daily closes was more than we could verify to the standard we hold ourselves to, so we checked the nine most recent completed turn dates, from 13 August to 5 November 2026. That is a small sample and should be read that way.
Data: ^AXJO daily closes from Yahoo Finance, 2 December 2024 to 11 November 2026, fetched 12 November 2026.
The rule is the same one we use for the S&P 500 call. A pivot is a daily close that is the highest (for a high) or lowest (for a low) of the 5 trading days before and the 5 trading days after. A turn date is a hit if a pivot of the same type falls within 3 calendar days. Two of the turn dates fall on a weekend, so the nearest sessions are used.
| Turn date | Type | What the ASX 200 closes did | Result |
|---|---|---|---|
| 13 Aug | High | Closed 9,188.5, then lower on each of the next four sessions | Miss |
| 27 Aug | Low | Closed 9,038.2, the lowest close of that week, but 8,978.4 on 2 Sep was lower | Miss |
| 2 Sep | High | Closed 8,978.4, a low point. It fell on to 8,672.5 by 15 Sep | Miss |
| 3 Oct (Sat) | Low | 1 Oct close of 8,614.4 was the lowest close in the 5 sessions either side | Hit |
| 7 Oct | High | Closed 8,727.7. The 30 Sep close of 8,789.3 was higher | Miss |
| 18 Oct (Sun) | Low | Closes rose from 8,719.7 on 15 Oct to 8,845.7 on 19 Oct | Miss |
| 21 Oct | High | 19 Oct close of 8,845.7 was the highest in the 5 sessions either side | Hit |
| 29 Oct | Low | Closed 8,891.8 in a rising run, no low | Miss |
| 5 Nov | High | Closed 9,065.1, up 2.6% on the day (from 8,834.5), but 9,129.0 on 10 Nov was higher | Miss |
That is 2 hits from 9, or 22%. The two hits were the 3 October low and the 21 October high, each within two days of an ASX pivot of the right type.
How to read that: it is a small sample on one index and it shows nothing in either direction. For comparison, on the S&P 500 over 1 January 2025 to 9 October 2026 the same rule gave 11 hits from 37 turn dates, and a set of random dates would have scored about 29.6% by luck (figures from our S&P 500 post). We have not run a chance baseline for the ASX 200, so we do not claim the 22% is better or worse than luck. What the table does give you is a record you can check yourself, line by line, from public closes.
Two cautions on the data. The 11 November row from Yahoo shows zero volume, so treat that last close as provisional. And the volume column repeats the same figure for several days in mid October, which we take as a data quirk. The closes are the only column we use.
How to use these dates
Treat them as alert windows, not signals. The siderograph says a curve changes slope on a day. It does not say whether the ASX 200 is rising or falling into it, how far it moves, or how long it lasts. A practical routine:
- Put the eight dates on your ASX 200 chart.
- Note which ones fall near levels you already watch, such as a Square of Nine level. Our worked example for the ASX 200 shows how to get those.
- Judge price action on those days with your own rules.
- Keep a log of hits and misses, as we have above. Ten or twenty entries tell you more than a hunch.
For a proper test across years, see our primer on backtesting cycle methods, which covers testing against chance and not tuning on the data you test on.
Questions people ask
Does the Bradley siderograph work on the ASX 200? On the nine most recent turn dates, 2 of 9 matched a closing pivot within 3 days. That is too small a sample to say either way. The peer-reviewed research linking the sky to returns covers other effects, such as lunar phase, and does not test the Bradley curve.
Are the dates different for the ASX 200 and the S&P 500? No. The siderograph uses planetary positions only, so the dates are the same for any market.
How do I run it myself? Choose the Bradley siderograph module, set the start and end dates, leave the planets, orb and variant on their defaults, and run it. The Bradley guide covers each setting.
Try it yourself
Run your own range and check it against the ASX 200 or any other market you follow. Create an account, open the Bradley siderograph module, and read the Bradley guide for each setting. The first run takes under a minute.
This is research and education, not financial advice.
Crohamhurst computes the Square of Nine, Bradley siderograph, planetary ephemeris, cycle scans and historical analogs from your own price data, in your browser. Plans start at $49 a month.
Create an account