Financial Astrology Software: Your First Ten Minutes in Crohamhurst
Crohamhurst is financial astrology software that runs in your browser and computes planetary dates and Gann levels in seconds. On the Starter plan you get 50 compute units a day, and a sensible first session of three modules uses 6 of them. This post walks through that session with the real results, so you know what you are buying before you pay.
We should say up front what the software is. It is a calculator. It computes planet positions from the JPL DE421 ephemeris, it computes dates and price levels from them, and it shows you the tables. It does not tell you what to trade. What it does well is take work that used to take an afternoon with ephemeris tables and do it exactly, so you can spend your time testing an idea instead of calculating it.
Step 1: Sign up and choose a plan
Go to the registration page, enter an email address and a password of at least 8 characters, and you are signed in. Then you choose a plan and pay through Stripe. There is no free plan, and the account cannot run computations until a plan is active.
The plans, in Australian dollars a month:
| Plan | Price a month | Compute units a day |
|---|---|---|
| Starter | $49 | 50 |
| Hobbyist | $119 | 1,000 |
| Pro | $249 | 10,000 |
Annual billing is ten times the monthly price. All six modules are open on every plan. The things that change with the plan are the daily units and whether the instrument picker can fetch price history for the Cycle Scanner. On Starter you can still paste your own closes into the Cycle Scanner and it behaves the same way. The getting started guide has the full detail.
How units work, in one paragraph
Every computation costs units, and the cost depends on how much work you ask for, not on your plan. A Gann Square of Nine run is 1 unit. The ephemeris is 2 units per year of date range. The Bradley siderograph is 3 units per year. A failed request costs nothing, because usage is recorded only after a computation succeeds. The counter resets at midnight UTC, which is 10:00 in Brisbane. Reading results and downloading CSV files cost nothing.
Step 2: Run a Square of Nine (1 unit)
Open Gann Square of Nine from the sidebar, type a price into the anchor field and press Run Square of Nine. We used an anchor of 100 and the default settings: a 45 degree step and four rings above and below.
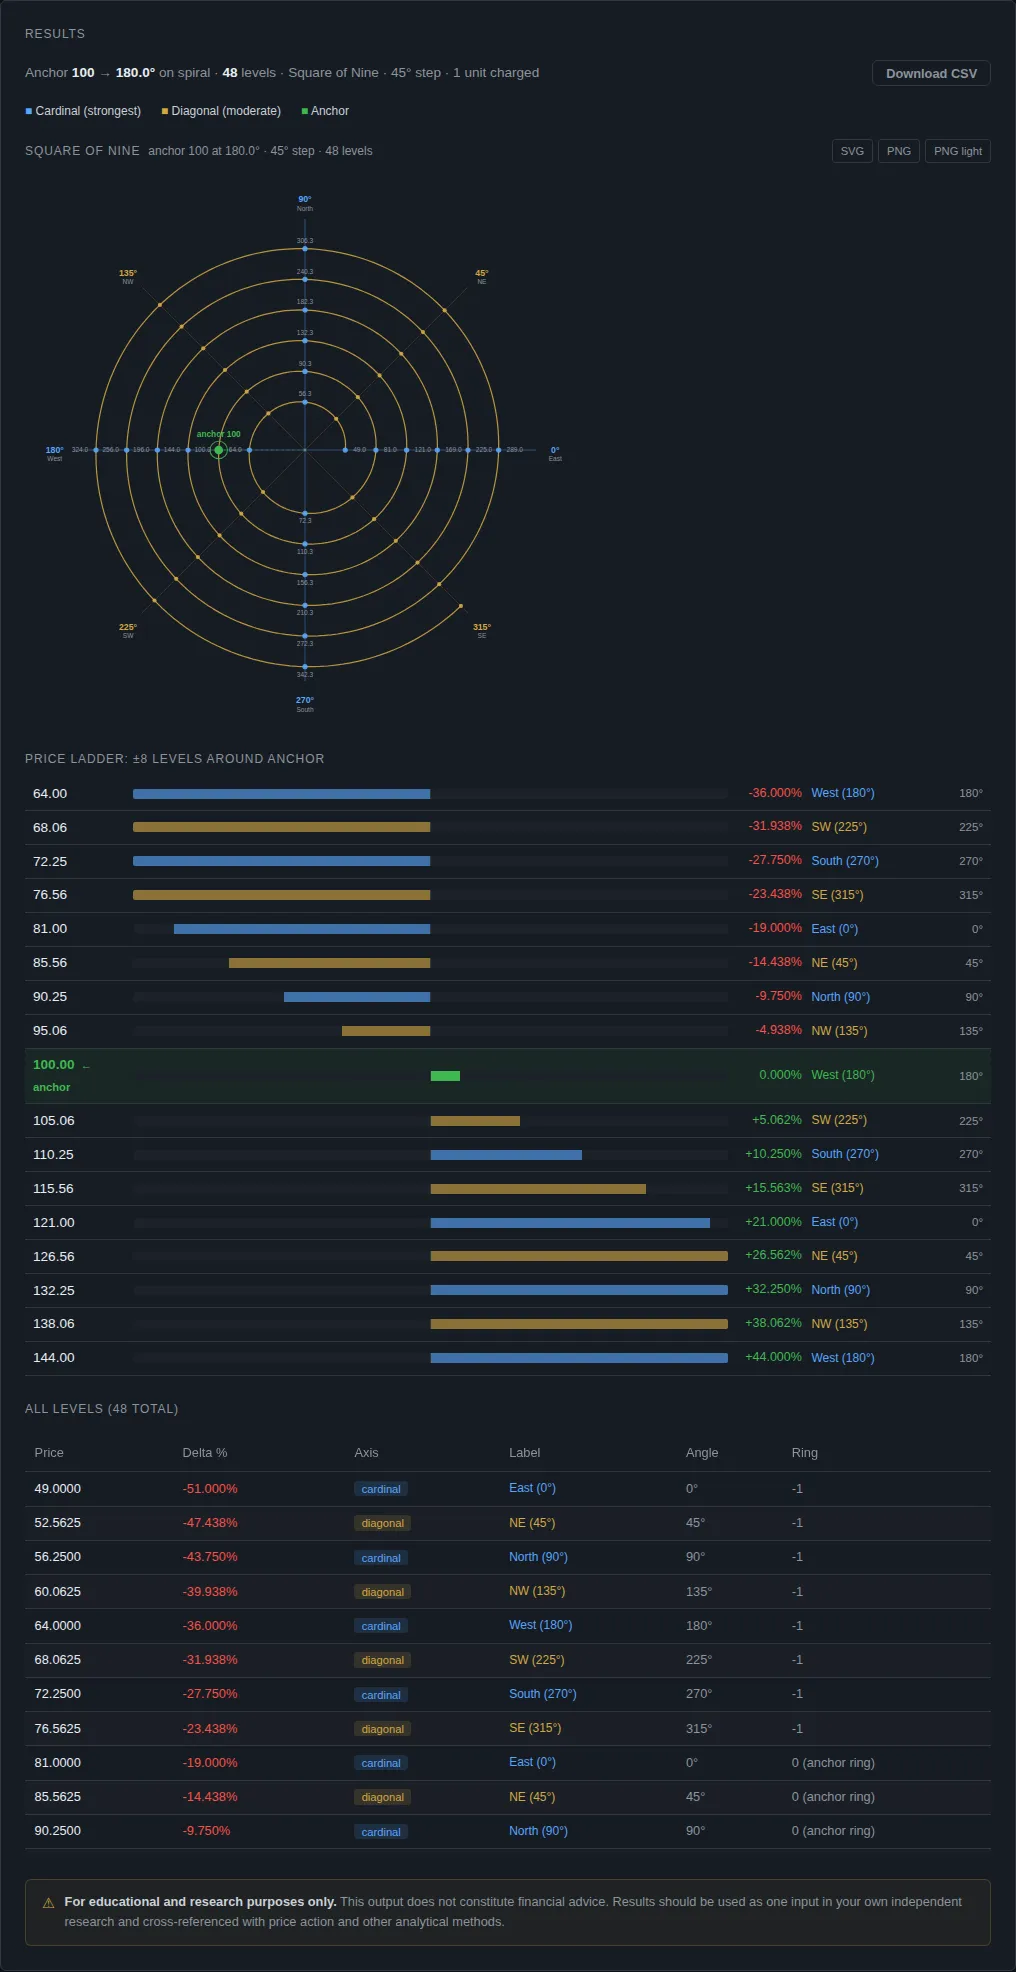
The result header reads "Anchor 100, 180.0 degrees on spiral, 48 levels, Square of Nine, 45 degree step, 1 unit charged". Below the spiral chart sits the price ladder. The levels just above 100 were:
- 105.06 (south-west, 225 degrees, diagonal), 5.06% above the anchor
- 110.25 (south, 270 degrees, cardinal), 10.25% above
- 115.56 (south-east, 315 degrees, diagonal), 15.56% above
- 121.00 (east, 0 degrees, cardinal), 21.00% above
Below 100 the nearest were 95.06, 90.25, 85.56 and 81.00. The maths is simple and you can check it by hand. The square root of 100 is 10. A 45 degree step moves the root by 0.25, so the next level is 10.25 squared, which is 105.0625. The app does that for every angle and ring, instantly, and labels cardinal and diagonal axes.
That is a good first lesson about the tool. The levels are exact arithmetic. Whether price respects them is a separate question, and one you can test. Note that more levels means more chances for price to land near one by luck, which is why we publish a luck baseline in our worked examples. See the Square of Nine guide for the method.
Step 3: Run an ephemeris for one year (2 units)
Open Ephemeris timelines. Choose a range, pick two planets, tick the aspects and set an orb. We ran Mars and Saturn, conjunction and opposition only, with the default orb of 1.5 degrees, for 1 January to 31 December 2026, in the geocentric frame.
The result was one event, and it cost 2 units:
| Date | Planets | Aspect | Separation | Orb |
|---|---|---|---|---|
| 2026-04-19 | Mars and Saturn | Conjunction | 0.293 degrees | 0.293 degrees |
The row also marks the aspect as applying, meaning the planets were still closing on exact. That answers a question that used to need a printed ephemeris and a protractor: on which dates does this pair form this angle? The answer is exact to the precision of the JPL kernel, not rounded to the nearest day from a chart.
Notice how short the list is. A tight selection gives a short, readable table. If you tick every planet and every aspect you will get hundreds of rows, and that is when chance starts to produce coincidences with price. Start narrow. The ephemeris guide explains orb and frame choices.
Step 4: Run a Bradley siderograph for the same year (3 units)
Open Bradley siderograph, set the same year and run it with the defaults. The defaults follow the published 1948 formula: nine bodies from the Sun to Pluto, a 15 degree orb, and declinations included. The run cost 3 units and returned 26 turning points for 2026, alternating between lows and highs.
The first few, as the app listed them:
| Date | Type |
|---|---|
| 2026-01-03 | low |
| 2026-01-19 | high |
| 2026-02-08 | low |
| 2026-03-07 | high |
| 2026-03-18 | low |
The date to compare against step 3 is simple: look at where the siderograph turned near the 19 April Mars and Saturn conjunction. The nearest turning points in the output were a high on 16 April and a low on 23 April. We are not claiming that means anything. We are showing you the habit the software is built for, which is putting two independent calculations next to each other and then asking whether that kind of overlap beats chance.
The turning-point dates are computed. They are not a forecast. If you want to see how we treat a Bradley call when the dates come due, our tracked calls scorecard scores each one by its written rule, hit or miss.
What the three runs cost
| Run | Units |
|---|---|
| Square of Nine, anchor 100 | 1 |
| Ephemeris, Mars and Saturn, one year | 2 |
| Bradley siderograph, one year | 3 |
| Total | 6 of 50 |
That leaves 44 units for the Cycle Scanner and Historical Analogs, or for more runs of the same modules. Fifty units is a lot of exploring if you keep date ranges short.
What to do next
Pick one idea, write down the rule before you look at the chart, and test it against chance. The tool is built for that. It gives you exact dates and levels fast, so you can run the test over many past years instead of trusting a single memorable example. Our post on what the app does well goes further on that, and the backtesting primer covers how to score a method honestly.
A caution on the research side. Some published work does find real effects tied to astronomical cycles, such as lunar phase returns, and we cover those with citations. Those are averages over many years, not a signal for next week, and nothing in the three runs above is a forecast.
Try it yourself
Create an account, pick a plan, and repeat the three runs above in a few minutes. The getting started guide lists the full ten minute sequence, including the Cycle Scanner and Historical Analogs.
This is research and education, not financial advice.
Crohamhurst computes the Square of Nine, Bradley siderograph, planetary ephemeris, cycle scans and historical analogs from your own price data, in your browser. Plans start at $49 a month.
Create an account