Astro trading software: what Crohamhurst does well
Astro trading software is most useful for the work that is tedious and easy to get wrong by hand: finding exact planetary aspect dates, working out price levels on a Gann spiral, and timing sign ingresses to the minute. Crohamhurst does those jobs in seconds from a browser, using the JPL DE421 ephemeris, and it lets you check any idea against chance before you put money near it.
This post is about what the tool does well. It does not claim that any of its output forecasts a market. Where we have tested a method and it missed, we say so in the posts about that method.
This is research and education, not financial advice.
1. Exact planet positions, from a real ephemeris
Everything starts with where the planets are. Crohamhurst reads positions from the JPL DE421 ephemeris, the same family of data that professional astronomy software uses. It covers 1899 to 2053, and the app accepts dates from 1900 to 2050.
That matters because a printed ephemeris gives you one position a day, and you interpolate the rest by eye. The app does the geometry for you, so you can ask a direct question and get a dated answer.
Here is a real run. We asked the Ephemeris module for conjunctions, squares and oppositions between the Sun, Mars, Jupiter and Saturn from 1 November to 31 December 2026, with a tight orb of 1 degree. It returned four events in a fraction of a second:
| Date | Aspect | Separation from exact |
|---|---|---|
| 16 Nov 2026 | Mars conjunct Jupiter | 0.085 degrees |
| 18 Nov 2026 | Sun square Jupiter | 0.092 degrees |
| 19 Nov 2026 | Sun square Mars | 0.14 degrees |
| 29 Dec 2026 | Sun square Saturn | 0.471 degrees |
The run cost 2 of the 50 compute units on the free plan's daily allowance. The dates are geocentric (as seen from Earth). You can switch to heliocentric if that is the frame you use.
Doing the same by hand means checking longitudes day by day for six planet pairs. It is not hard, but it is slow, and one slip puts a date out by a day. This is the first thing software is good for.
2. Gann levels without the spreadsheet
The Square of Nine turns a price into an angle on a spiral, then reads off the prices that sit at the same angle on the rings either side. The formula is simple, and the arithmetic is where people slip.
We ran the Gann module on the ASX 200. The last close in our data (Yahoo Finance ticker ^AXJO, daily closes, 1 April to 9 October 2026, fetched 14 October 2026) was 8,716.60. With 45 degree steps and one ring either side, the module returned 24 levels in one request, costing 1 unit. The nearest two were:
- 8,695.56, on the NE diagonal, 0.24% below the close
- 8,742.25, on the North cardinal axis, 0.29% above the close
The next cardinal levels were 8,649.00 (East, 0.78% below) and 8,836.00 (West, 1.37% above).
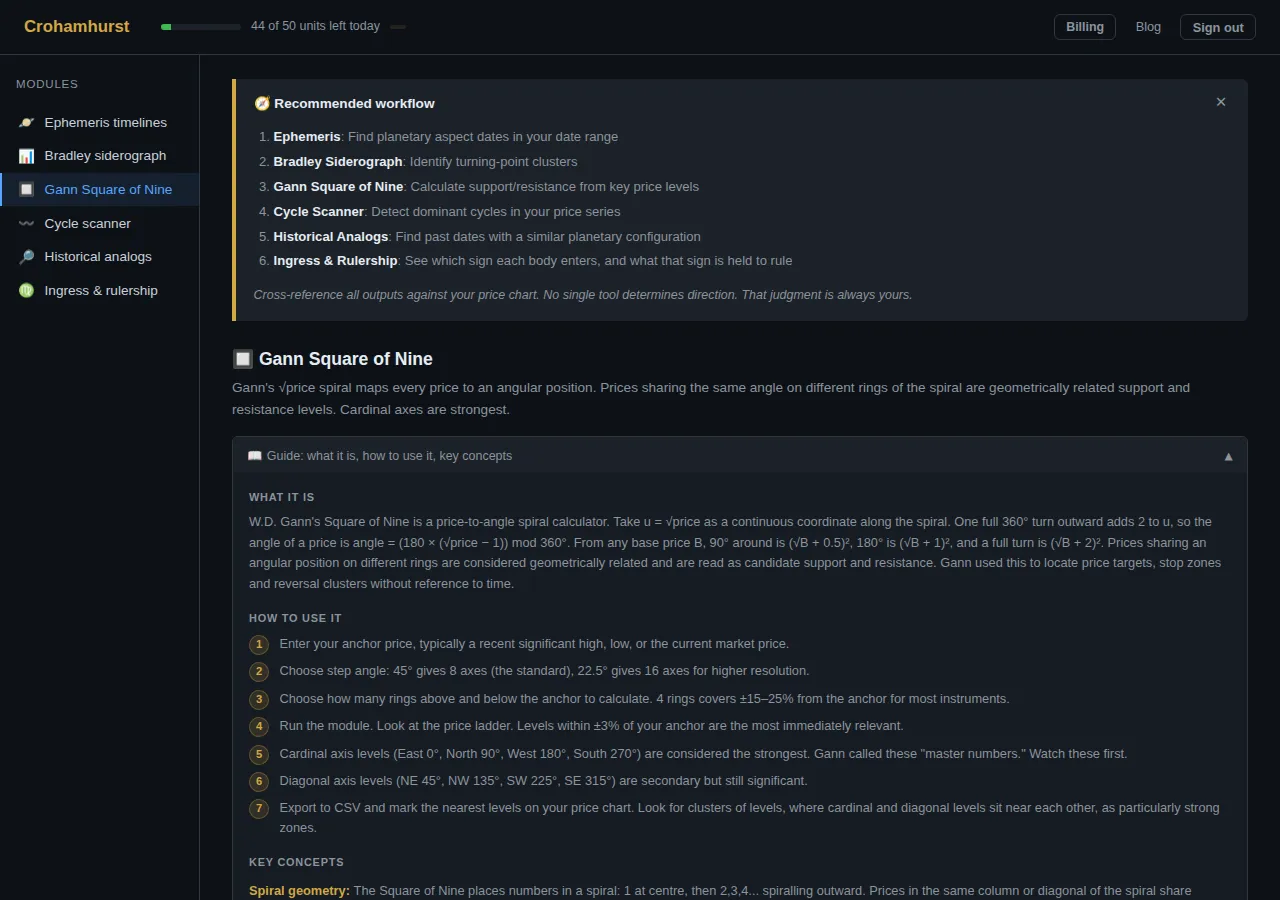
There is a fair warning in those numbers, and we would rather you read it here than discover it later. The levels sit about 0.5% apart. With levels that close together, a price is always near one of them, so a price touching a level is not evidence that the level did anything. The right test is to compare how often price reacts at the levels against how often it reacts at an equal number of randomly placed lines. Our Square of Nine guide and the free Square of Nine calculator cover how to run that comparison.
What the software does well is give you the levels instantly and correctly, so your time goes to the testing and not the arithmetic.
3. Ingress dates to the minute
A sign ingress is the moment a planet crosses from one zodiac sign into the next. The four cardinal ingresses (the Sun entering Aries, Cancer, Libra and Capricorn) mark the equinoxes and solstices, and many market astrologers build a chart for each.
We ran the Ingress module for the Sun across 2027 (2 units). It found 12 ingresses. The ones in the middle of the year:
| Event | Date and time (UTC) |
|---|---|
| Sun enters Aries (March equinox) | 20 Mar 2027, 20:24 |
| Sun enters Cancer (June solstice) | 21 Jun 2027, 14:11 |
| Sun enters Libra (September equinox) | 23 Sep 2027, 06:02 |
Each ingress also comes with the sign's element, modality and traditional ruler, and the module has a reference table of classical commodity attributions. It labels where each attribution comes from (traditional, modern or a named source), which is the honest way to present material that is tradition and not measurement.
The calendar and the times are computed. The meaning that astrologers attach to them is a separate question, and one you can test. For a worked look at reading an ingress, see our ingress guide.
4. Six modules that fit together
The dashboard lists six modules in the order we suggest using them: Ephemeris timelines, Bradley siderograph, Gann Square of Nine, Cycle scanner, Historical analogs, and Ingress and rulership.
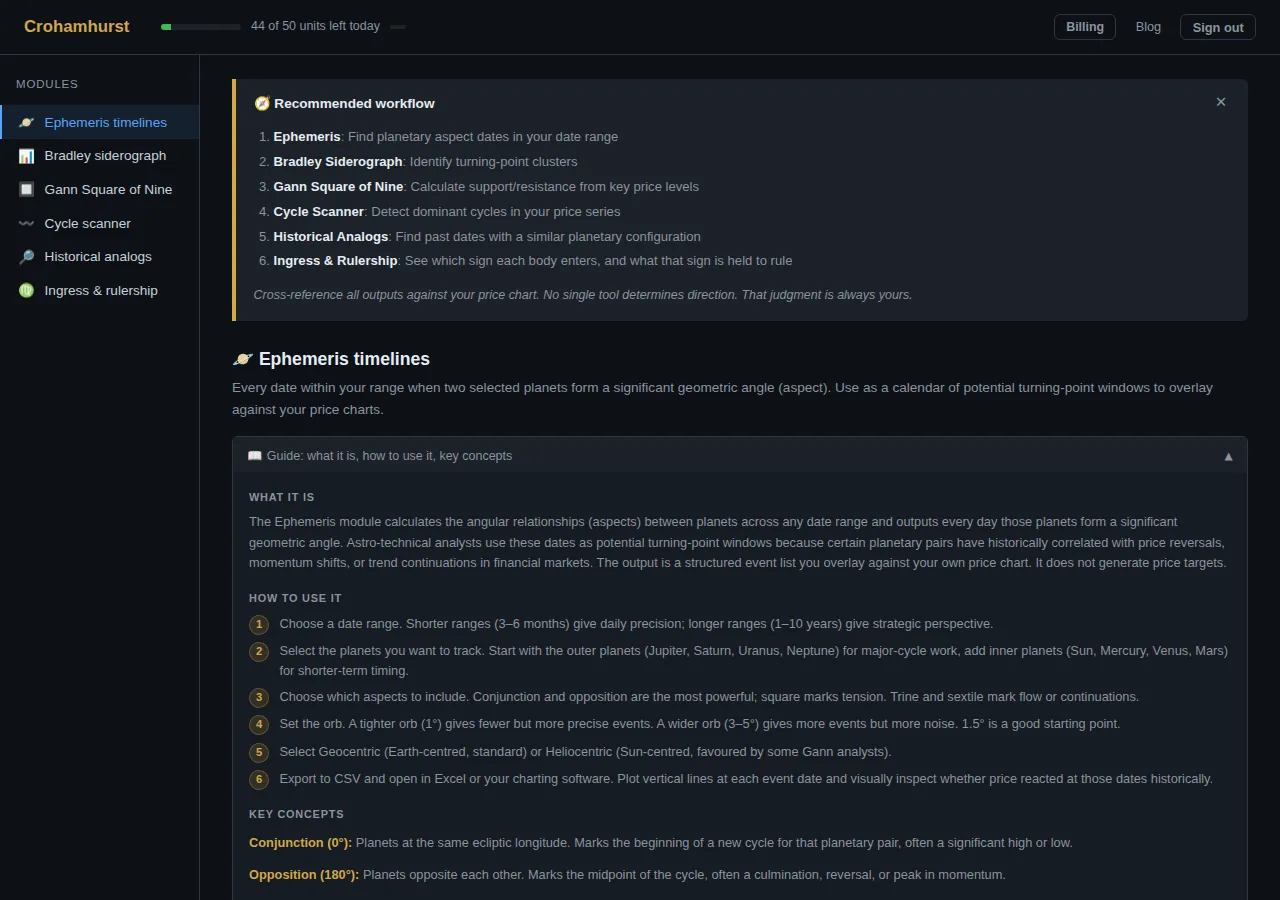
Each module has a built-in guide on the same screen, explaining what it is, how to use it and the key concepts. The recommended workflow box carries a line we agree with: no single tool determines direction, and that judgment is yours.
- Ephemeris timelines gives aspect dates in any range up to 10 years.
- Bradley siderograph computes the 1948 formula, with the published 15 degree orb as the default. Our Bradley guide walks through it.
- Cycle scanner finds the dominant cycles in up to 2,048 price bars. See the post on FFT, Hurst and Bartels cycle analysis.
- Historical analogs looks for past dates with a similar planetary configuration.
5. A way to test an idea before you trust it
This is the part we think matters most. Software can draw a line on a chart for almost any idea. It is much rarer to have a way to ask whether the line is any better than a random one.
Some timing ideas have real research behind them, such as the moon and seasonal studies we cover in our full moon post. Others do not hold up when tested. The only way to tell is to put the dates down and score them against a baseline.
The tools to do that are in the app: exact dates from the Ephemeris module, a Bartels test for whether a cycle is more than chance (see the Bartels post), and a backtesting method you can follow with any price series. We also publish our own calls in advance, with the rule written down, in the tracked calls scorecard, so a hit or a miss is scored by the rule we set beforehand.
What it does not do
To be plain about the limits:
- It does not tell you what a market will do. A planetary date is a date. Whether price cares is a question for your own testing.
- A published effect in the research is an average over many years, not a signal for next week.
- The free plan has 50 compute units a day. Big scans and long ranges cost more units, and the paid plans (at $19 and $49 a month) raise the daily allowance.
- Its output is only as useful as the price data and judgment you bring to it.
Try it yourself
Create a free account and run the Ephemeris module for the next two months. It costs a couple of units, and you will have a dated list of aspects to overlay on your own charts. The getting started guide shows the first steps, and the ephemeris guide explains the module in full.
This is research and education, not financial advice.
Crohamhurst computes the Square of Nine, Bradley siderograph, planetary ephemeris, cycle scans and historical analogs from your own price data, in your browser. The free plan needs no card.
Create free account