Seasonal affective disorder and the stock market, seen from Australia
The seasonal affective disorder stock market research is one of the few calendar effects published in a top economics journal. In 2003 the American Economic Review carried "Winter Blues: A SAD Stock Market Cycle" by Kamstra, Kramer and Levi (volume 93, pages 324 to 343), which linked stock returns to the length of the day and reported that Southern Hemisphere markets follow the same pattern six months out of phase. That last part is the bit that matters for an Australian investor, so we explain the study, compute the season dates with the app, and check the half-year pattern on the ASX 200.
What the study found
The authors started from a medical observation. Seasonal affective disorder is a documented form of depression that follows the shortening of the days, and depressed people take fewer risks, financial risks included. If enough investors feel it, risk appetite in the whole market should breathe with the seasons.
They tested that on stock indices at different latitudes. A University of British Columbia report on the study at the time summarised the results plainly: short winter days were associated with higher returns, long summer days with lower ones, markets farther from the equator showed the larger swings, and southern markets reacted six months out of phase because their seasons are reversed. The proposed chain is daylight to mood, mood to risk aversion, risk aversion to the prices people will pay.
Two honest notes before anyone trades on it. First, the effect is an average over decades of data, not a timetable for next week. Second, it has been challenged in print: Jacobsen and Marquering (Journal of Banking & Finance, 2009) showed that the same summer-winter pattern can be "explained" just as well by anything else that moves with the seasons, their deliberately silly examples being ice cream consumption and airline travel. Seasonality in returns is easier to show than its cause.
The Australian calendar is the mirror image
For a reader in Australia the paper's Northern Hemisphere wording has to be flipped. Our days shorten from late December and are at their shortest in late June. The half of the year the SAD argument cares about, the stretch where nights are longer than days, runs from the March equinox to the September equinox.
Those boundaries are astronomy, so the app computes them rather than looking them up. A season starts at the instant the Sun's ecliptic longitude crosses a cardinal sign boundary, and the Ingress module finds each crossing from the JPL DE421 ephemeris by bisection, to the minute. Here is the full 2026 run for the Sun, twelve ingresses, with the four season points among them:
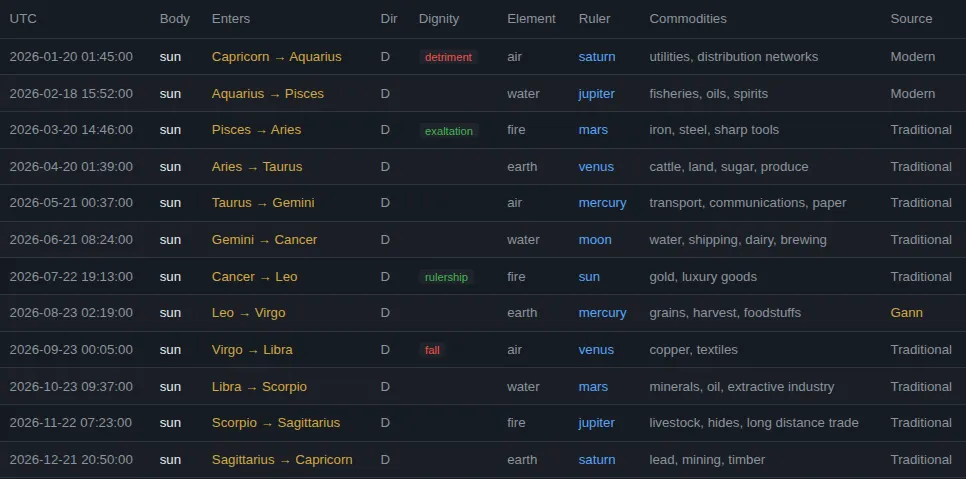
The four cardinal crossings in that table are the 2026 season dates. In UTC and Brisbane time (AEST, UTC+10):
| Season point | Sun enters | UTC | AEST |
|---|---|---|---|
| Autumn equinox | Aries | 20 Mar 2026, 14:46 | 21 Mar 2026, 00:46 |
| Winter solstice | Cancer | 21 Jun 2026, 08:24 | 21 Jun 2026, 18:24 |
| Spring equinox | Libra | 23 Sep 2026, 00:05 | 23 Sep 2026, 10:05 |
| Summer solstice | Capricorn | 21 Dec 2026, 20:50 | 22 Dec 2026, 06:50 |
Our check: ten and a half years of ASX 200 halves
The paper's own test is a daily regression with a night-length variable, an autumn dummy and a set of controls. We ran something much simpler that any reader can repeat: split each year at the two equinoxes and compare the dark half (autumn plus winter, long nights) with the light half (spring plus summer).
Method, stated exactly. Equinox instants for 2016 to 2026 were computed in the app's Ingress module (Sun only, geocentric). For each equinox we took the ASX 200 close on its AEST date, or the last trading day before it when the equinox fell on a weekend. Closes are Yahoo Finance daily data for the ticker ^AXJO, 1 March 2016 to 30 September 2026, a price index with dividends not included. Each half-year return is end close divided by start close, minus one.
The dark halves, March equinox to September equinox:
| Year | Start close | End close | Return |
|---|---|---|---|
| 2016 | 5,183.1 (18 Mar) | 5,431.3 (23 Sep) | +4.8% |
| 2017 | 5,778.9 (20 Mar) | 5,655.4 (22 Sep) | -2.1% |
| 2018 | 5,950.3 (21 Mar) | 6,194.6 (21 Sep) | +4.1% |
| 2019 | 6,167.2 (21 Mar) | 6,749.7 (23 Sep) | +9.4% |
| 2020 | 4,816.6 (20 Mar) | 5,784.1 (22 Sep) | +20.1% |
| 2021 | 6,708.2 (19 Mar) | 7,370.2 (23 Sep) | +9.9% |
| 2022 | 7,278.5 (21 Mar) | 6,574.7 (23 Sep) | -9.7% |
| 2023 | 6,955.4 (21 Mar) | 7,068.8 (22 Sep) | +1.6% |
| 2024 | 7,695.8 (20 Mar) | 8,209.5 (20 Sep) | +6.7% |
| 2025 | 7,918.9 (20 Mar) | 8,845.9 (23 Sep) | +11.7% |
| 2026 | 8,428.4 (20 Mar) | 8,765.3 (23 Sep) | +4.0% |
And the light halves, September equinox to the next March equinox:
| Half | Start close | End close | Return |
|---|---|---|---|
| 2016-17 | 5,431.3 | 5,778.9 | +6.4% |
| 2017-18 | 5,655.4 | 5,950.3 | +5.2% |
| 2018-19 | 6,194.6 | 6,167.2 | -0.4% |
| 2019-20 | 6,749.7 | 4,816.6 | -28.6% |
| 2020-21 | 5,784.1 | 6,708.2 | +16.0% |
| 2021-22 | 7,370.2 | 7,278.5 | -1.2% |
| 2022-23 | 6,574.7 | 6,955.4 | +5.8% |
| 2023-24 | 7,068.8 | 7,695.8 | +8.9% |
| 2024-25 | 8,209.5 | 7,918.9 | -3.5% |
| 2025-26 | 8,845.9 | 8,428.4 | -4.7% |
Averaging the columns: the eleven dark halves returned +5.5% on average and nine of the eleven were positive. The ten light halves averaged +0.4%, with five of ten positive. The direction matches what Kamstra, Kramer and Levi would predict for a Southern Hemisphere market: the long-night half was the better one in this window.
Before you get excited, look at the two outliers
The gap looks like five percentage points, but most of it sits in two extreme halves. The 2019-20 light half contains the COVID crash, a fall of 28.6%, and the 2020 dark half contains the rebound, a rise of 20.1%. A pandemic is not a daylight effect. Remove just the COVID half and the light average climbs to +3.6%. Remove the matching rebound half as well and the dark average comes down to +4.0%. The seasonal gap in the remaining nineteen ordinary halves is about half a percentage point, which on a sample this small is indistinguishable from noise.
Three more limits worth stating. Our split is far cruder than the paper's daily regression, which also separated an autumn effect from a winter one. Our index ignores dividends, and Australian dividend yields are high enough that the light half, which contains more ex-dividend activity around the February reporting season, gives up some measured return that shareholders actually received. And Australia's markets sit at mid latitudes, Sydney at 34 degrees south, Brisbane at 27, while the paper found the effect grows with distance from the equator, so Australia is exactly where it should be weak.
So our reading is modest: the published effect is real research in a serious journal, the direction on the ASX 200 over the last decade is consistent with it, and the honest size of it here, once two pandemic halves are set aside, is too small to trade on by itself. That is also roughly what the paper's critics argue you should expect to find. If you want to see how this kind of check can go wrong, our backtesting primer walks through the usual traps, hindsight splits included.
Try it yourself
The season dates are the easy part to verify: sign up for a free account, open the Ingress module, set the range to any year, pick the Sun and run it. The four cardinal crossings are your equinoxes and solstices to the minute, and the ingress guide explains the rest of the table. From there you can repeat our half-year split on any index with free daily data, exactly as described above.
This is research and education, not financial advice.
Crohamhurst computes the Square of Nine, Bradley siderograph, planetary ephemeris, cycle scans and historical analogs from your own price data, in your browser. The free plan needs no card.
Create free account