Full moon stock market returns: what the research found, and our 2025 check
Most market folklore about the Moon has never been tested. This one has. In 2006 three finance researchers, Kathy Yuan, Lu Zheng and Qiaoqiao Zhu, published a study in the Journal of Empirical Finance that looked at stock markets in 48 countries. Their finding: returns were lower on the days around a full moon than on the days around a new moon, by about 3 to 5% a year.
That is a peer-reviewed result in a mainstream finance journal, not a forum post. So we did what we do with every idea: explain it plainly, then rerun it on our own data and report what came out. This post covers both.
This is research and education, not financial advice.
What the study did
The paper is "Are investors moonstruck? Lunar phases and stock returns" (Journal of Empirical Finance, volume 13, issue 1, pages 1 to 23, January 2006). According to its abstract, the authors:
- studied the stock market returns of 48 countries,
- found returns lower around full moons than around new moons,
- measured the gap at 3% to 5% per annum, using two global portfolios, one equal-weighted and one value-weighted,
- checked that the gap was not explained by changes in volatility or trading volume,
- checked that it was not explained by macroeconomic announcements or major global shocks,
- and found it independent of other calendar effects, including the January effect, the day-of-week effect, the calendar month effect and the holiday effect.
That last point matters. A lot of calendar "effects" turn out to be the same effect seen from a different angle. The authors say this one is not.
The explanation usually offered for results like this is mood: if the lunar cycle nudges how people feel and sleep, it could nudge how they trade. The paper reports the return pattern. It does not prove the cause, and neither do we.
What an effect of this size means in practice
A difference of 3 to 5% a year sounds large. Spread across a year, it is small per lunar month. There are about 12.4 lunar months a year, so by our rough calculation (3% to 5% divided by 12.4) the gap works out to something like 0.25 to 0.4 percentage points per month between the full moon half and the new moon half.
Against that, a two week stretch of a stock index can easily move 2, 5 or even 10%. That is why the original study needed 48 countries. A small average effect only shows up when you pool a very large amount of data. It is also why a published effect like this is an average over many years and many markets, not a signal for next week.
Keep that in mind for the next part.
How we set up our check
The app does the hard part in seconds. We used the Ephemeris timelines module to list every date the Sun and Moon formed a conjunction (new moon), a square (first or last quarter) or an opposition (full moon), geocentric, with a 7 degree orb. For September 2024 to September 2026 that is one run, and it cost 4 of the 50 compute units the free plan gets each day.
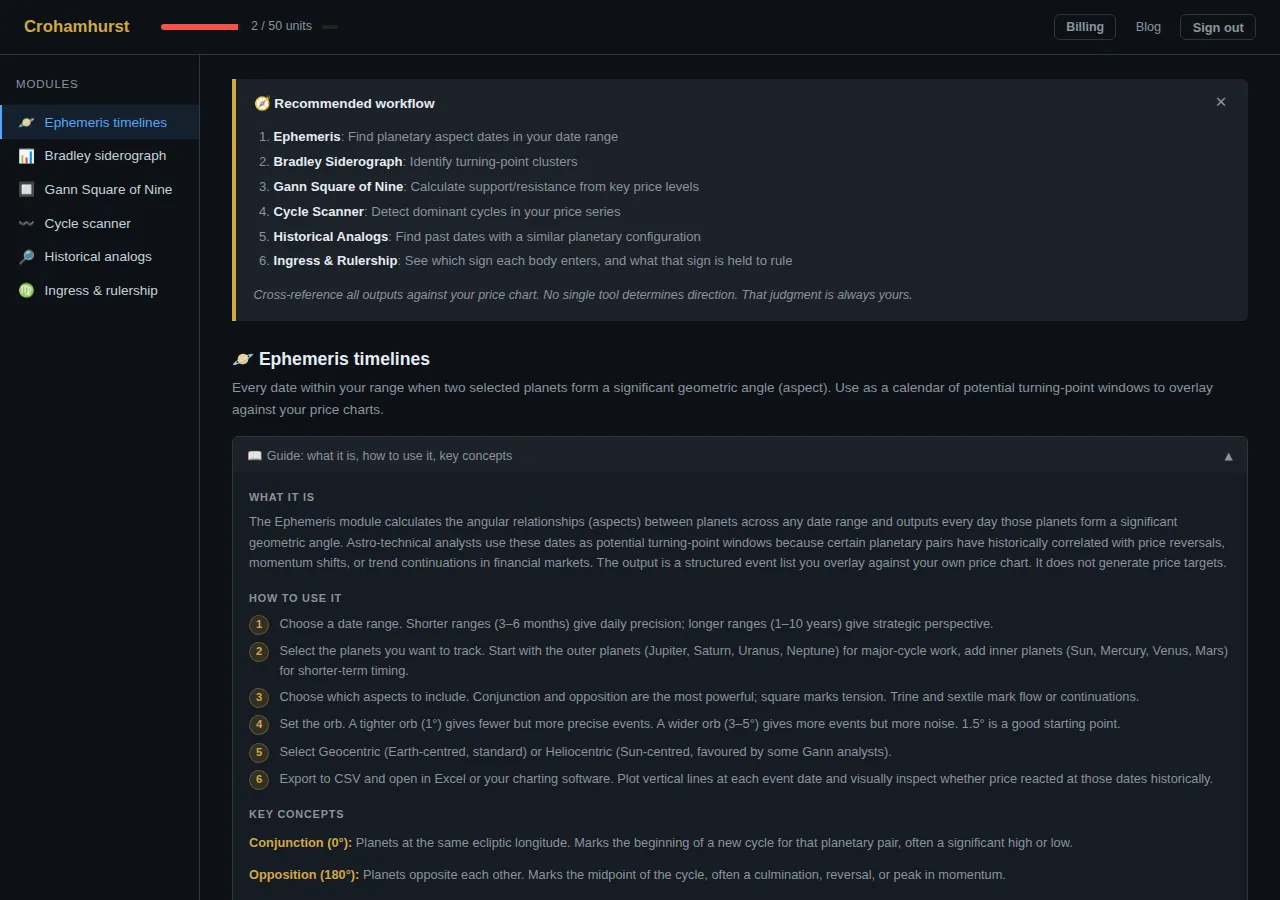
The module checks the angle once per UTC day and lists the day it comes closest to exact, so a listed date can sit a day either side of the exact moment of the phase. The orb only sets how close that day must be to count. We reran the same range with a 1.5 degree orb as a check, and the dates it returned (for example the full moons of 12 February, 5 November 2025 and 3 January 2026, the new moons of 29 January, 29 March, 25 June and 21 October 2025) matched the first run.
Then we split each lunar month in two at the quarter moons:
- Full moon half: from the first quarter to the last quarter, with the full moon in the middle.
- New moon half: from the last quarter to the next first quarter, with the new moon in the middle.
This is our own simple split, a two week window either side, chosen so every trading day lands in exactly one half. It is close to the idea of "days around the full moon" versus "days around the new moon", but it is not a copy of the paper's method, and we say so.
For each half we took the index close on the boundary date (or the last close before it, if the market was shut that day) and worked out the percentage change. The test period is 13 full lunar months, from the last quarter of 22 December 2024 to the last quarter of 10 January 2026. That gives 13 full moon halves and 13 new moon halves for each index:
- S&P 500, Yahoo ticker ^GSPC
- ASX 200, Yahoo ticker ^AXJO
As a check on the arithmetic, the window changes chain together into the whole period: compounded, the S&P 500 windows give about +17.5%, which matches 5,930.85 to 6,966.28 (20 December 2024 to 9 January 2026), and the ASX 200 windows give about +8.1%, which matches 8,067.0 to 8,717.8 over the same dates.
What our run shows
| Index | Full moon halves, average change | New moon halves, average change | Full moon halves up | New moon halves up |
|---|---|---|---|---|
| S&P 500 | +1.10% | +0.27% | 10 of 13 | 9 of 13 |
| ASX 200 | +0.33% | +0.30% | 7 of 13 | 7 of 13 |
On the ASX 200 the two halves were practically the same: +0.33% against +0.30%, seven up out of 13 each.
On the S&P 500 the full moon halves did better, the opposite way round to the paper. But look at where the gap comes from. The new moon half from 21 March to 4 April 2025 fell 10.47% (5,667.56 to 5,074.08), during the April 2025 tariff sell-off, and the new moon half before it, 20 February to 6 March, fell 6.20%. The very next new moon half then rose 10.25%. Three windows decide the whole comparison.
A rough way to size this: the new moon halves on the S&P 500 had a standard deviation of about 4.9 points, the full moon halves about 1.5 points. With 13 windows each, that puts the standard error of the gap between the two averages at about 1.4 points (the square root of 4.9² / 13 plus 1.5² / 13). The gap we measured, 0.83 points, is smaller than that. In plain words: one year of data cannot tell this apart from chance, whichever way it points.
Here are all 26 windows for each index, so you can check them.
S&P 500 (^GSPC)
| Half | From | To | Change |
|---|---|---|---|
| New moon | 20 Dec 2024 | 6 Jan 2025 | +0.75% |
| Full moon | 6 Jan | 21 Jan | +1.24% |
| New moon | 21 Jan | 5 Feb | +0.20% |
| Full moon | 5 Feb | 20 Feb | +0.92% |
| New moon | 20 Feb | 6 Mar | -6.20% |
| Full moon | 6 Mar | 21 Mar | -1.24% |
| New moon | 21 Mar | 4 Apr | -10.47% |
| Full moon | 4 Apr | 21 Apr | +1.66% |
| New moon | 21 Apr | 2 May | +10.25% |
| Full moon | 2 May | 20 May | +4.46% |
| New moon | 20 May | 3 Jun | +0.50% |
| Full moon | 3 Jun | 18 Jun | +0.18% |
| New moon | 18 Jun | 2 Jul | +4.12% |
| Full moon | 2 Jul | 18 Jul | +1.11% |
| New moon | 18 Jul | 1 Aug | -0.93% |
| Full moon | 1 Aug | 15 Aug | +3.40% |
| New moon | 15 Aug | 29 Aug | +0.16% |
| Full moon | 29 Aug | 12 Sep | +1.92% |
| New moon | 12 Sep | 29 Sep | +1.17% |
| Full moon | 29 Sep | 13 Oct | -0.10% |
| New moon | 13 Oct | 29 Oct | +3.54% |
| Full moon | 29 Oct | 12 Nov | -0.58% |
| New moon | 12 Nov | 28 Nov | -0.03% |
| Full moon | 28 Nov | 11 Dec | +0.76% |
| New moon | 11 Dec | 26 Dec | +0.42% |
| Full moon | 26 Dec | 9 Jan 2026 | +0.52% |
ASX 200 (^AXJO)
| Half | From | To | Change |
|---|---|---|---|
| New moon | 20 Dec 2024 | 6 Jan 2025 | +2.75% |
| Full moon | 6 Jan | 21 Jan | +1.59% |
| New moon | 21 Jan | 5 Feb | -0.04% |
| Full moon | 5 Feb | 20 Feb | -1.12% |
| New moon | 20 Feb | 6 Mar | -2.74% |
| Full moon | 6 Mar | 21 Mar | -2.02% |
| New moon | 21 Mar | 4 Apr | -3.32% |
| Full moon | 4 Apr | 17 Apr | +1.97% |
| New moon | 17 Apr | 2 May | +5.36% |
| Full moon | 2 May | 20 May | +1.28% |
| New moon | 20 May | 3 Jun | +1.48% |
| Full moon | 3 Jun | 18 Jun | +0.76% |
| New moon | 18 Jun | 2 Jul | +0.78% |
| Full moon | 2 Jul | 18 Jul | +1.86% |
| New moon | 18 Jul | 1 Aug | -1.09% |
| Full moon | 1 Aug | 15 Aug | +3.19% |
| New moon | 15 Aug | 29 Aug | +0.39% |
| Full moon | 29 Aug | 12 Sep | -1.21% |
| New moon | 12 Sep | 29 Sep | -0.02% |
| Full moon | 29 Sep | 13 Oct | +0.23% |
| New moon | 13 Oct | 29 Oct | +0.49% |
| Full moon | 29 Oct | 12 Nov | -1.42% |
| New moon | 12 Nov | 28 Nov | -2.11% |
| Full moon | 28 Nov | 11 Dec | -0.26% |
| New moon | 11 Dec | 24 Dec | +1.99% |
| Full moon | 24 Dec | 9 Jan 2026 | -0.51% |
The ASX was closed on Easter Monday, 21 April 2025, and on Boxing Day, so those boundaries use the 17 April and 24 December closes. US dates follow the New York trading day and ASX dates the Sydney trading day, while the lunar dates are UTC days. At this window size a one day shift barely matters, but it is there.
How to read this
Our run does not confirm the paper, and it does not refute it either. It was never going to do either. The study measured an average gap of a few tenths of a point per month across 48 markets. We looked at 13 months of two markets, in a year with a sharp sell-off and rebound in April. A 10% move in a single window swamps an effect that size completely.
What the check does show is useful:
- The lunar dates are the easy part. The app gives every phase date for two years in one run, to ephemeris precision, so the timing side of any lunar test is solid.
- The noise is the hard part. One window can carry a whole year's comparison. Any lunar claim based on a handful of months, in either direction, deserves the same caution.
- Published effects need long samples. To see a gap of 0.25 to 0.4 points a month against window swings of several points, you need decades of data or many markets pooled, which is what the authors did.
So the fair summary is this. A careful peer-reviewed study found that returns around full moons were lower on average, across many countries, and the authors ruled out several easy explanations. One year of the S&P 500 and the ASX 200 is far too short to see that, and in 2025 it did not show. Neither result is a trading signal.
If you want to take it further, the next step is a longer run: more years of lunar dates from the ephemeris module, a longer price history, and the same split. Our backtesting primer covers how to compare a timing rule against chance before you trust it.
Try it yourself
- Create a free account. The free plan includes 50 compute units a day.
- Open Ephemeris timelines, pick the Sun and the Moon, tick conjunction, square and opposition, and set your date range. The ephemeris guide walks through every field.
- Export the dates, line them up against the daily closes of the index you follow, and split each month at the quarter moons as we did here.
Report what you find, whichever way it goes. That is the only way any of this gets better.
This is research and education, not financial advice. Past returns, around any phase of the Moon, do not tell you what comes next.
Crohamhurst computes the Square of Nine, Bradley siderograph, planetary ephemeris, cycle scans and historical analogs from your own price data, in your browser. The free plan needs no card.
Create free account