Gann Square of Nine for Bitcoin: A Worked Example
Type one bitcoin price into the Square of Nine and the app hands back a full ladder of levels in a single step. From the 30 June 2026 closing low of 58558.86 it lists cardinal levels at 58081.00, 58322.25, 58564.00, 58806.25 and on up. This post shows how to run it, how to read it, and how bitcoin's closes sat against the grid, including the misses.
The useful part comes first. The spiral arithmetic is exact and the app does it instantly. You can then test the levels against real closes before you give them any weight. That is the point of doing it this way.
What the Square of Nine does
The Square of Nine is a number spiral. Take the square root of a price, add a quarter or half a turn, and square the result. Each step gives a price that shares an angle on the spiral with your starting price. The app marks the 0, 90, 180 and 270 degree levels as cardinal, and the 45 degree levels in between as diagonal.
For the background and the history, see our Square of Nine guide. This post is the worked example for one market.
Step 1: choose the anchor from a stated rule
The anchor is the one input that is up to you, so pick it by a rule you write down first. Otherwise you can try ten anchors and keep the one that looks best.
Our rule: the lowest daily close of bitcoin from 1 January 2025 to 22 October 2026. We pulled the closes from Yahoo Finance (ticker BTC-USD) on 26 October 2026. The lowest close in that range is 58558.86 on 30 June 2026. The highest close is 124752.53 on 6 October 2025, so the low sits 53.1% below the high. The latest close in our data, on 22 October 2026, is 81311.89, which is 38.9% above the low.
(53.1% is 1 - 58558.86 / 124752.53. 38.9% is 81311.89 / 58558.86 - 1.)
Step 2: run the module
It costs 1 compute unit, and the free plan includes 50 units a day.
- Sign in at crohamhurst.app and open the dashboard.
- Choose Gann Square of Nine from the sidebar.
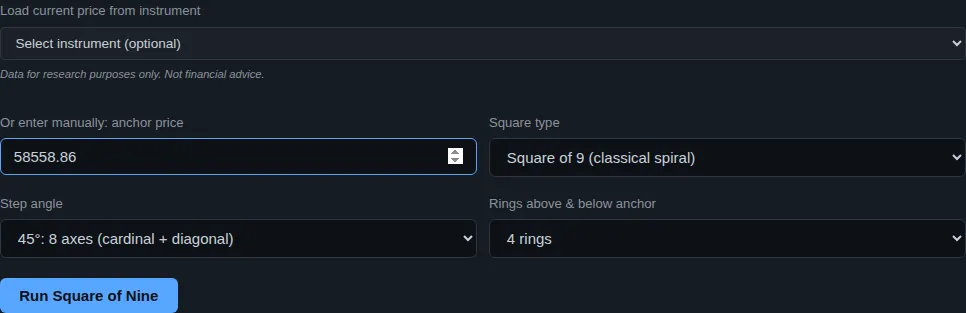
- Type 58558.86 into the anchor price box.
- Leave the step at 45 degrees and the rings at 4.
- Press Run Square of Nine.
Step 3: read the ladder
The app places 58558.86 at 178.1 degrees on the spiral, almost exactly on the 180 degree west axis. That is a coincidence of this price, not something we chose. The module returns the levels for 4 rings. This is the start of the table:
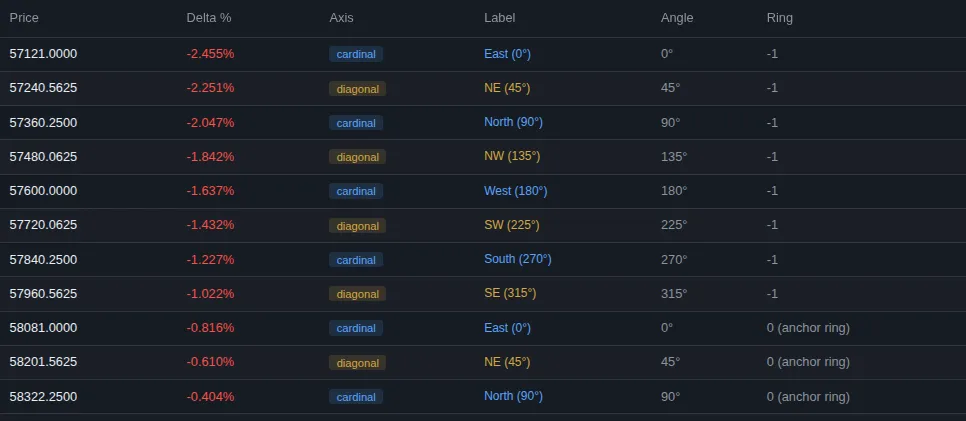
The cardinal levels near the anchor from that run:
| Level | Type | Distance from the anchor |
|---|---|---|
| 58081.00 | Cardinal (East) | -0.82% |
| 58322.25 | Cardinal (North) | -0.40% |
| 58564.00 | Cardinal (West) | +0.01% |
| 58806.25 | Cardinal (South) | +0.42% |
| 59049.00 | Cardinal (East) | +0.84% |
| 59292.25 | Cardinal (North) | +1.25% |
Each level is a square of a multiple of one half, so the grid is the same whichever anchor you use. The anchor only decides which part of it you see. Cardinal levels here are 241.25 points apart, about 0.41% of the price. That spacing matters in the next two sections.
What the closes did against the grid
We checked three points, chosen by simple rules before looking at the levels:
- The lowest close in the window (the anchor, 30 June 2026).
- The highest close in the window (6 October 2025).
- The highest close since the low (21 September 2026, 86602.91).
We counted a "fit" as a close within 0.1% of a cardinal level. For the two high points we ran the module again with those prices, so the nearest cardinal levels come from the app too.
| Point | Close | Nearest cardinal level | Distance | Fit? |
|---|---|---|---|---|
| Window low, 30 Jun 2026 | 58558.86 | 58564.00 | 0.01% | Yes |
| Window high, 6 Oct 2025 | 124752.53 | 124609.00 | 0.12% | No |
| High since the low, 21 Sep 2026 | 86602.91 | 86730.25 | 0.15% | No |
The distance is the level minus the close, divided by the close. For the low that is (58564.00 - 58558.86) / 58558.86 = 0.009%. For the October 2025 high it is (124609.00 - 124752.53) / 124752.53 = -0.115%. For the September 2026 high it is (86730.25 - 86602.91) / 86602.91 = 0.147%.
So the low landed very close to a cardinal level, and both highs fell just outside our band. One fit from three points is the honest count.
How often would a random price fit?
This is the check the app lets you run before you trust a level. A band of 0.1% either side is 0.2% wide. Divide that by the gap between cardinal levels at that price and you get the chance of a random close fitting:
| Price area | Gap between cardinal levels | Chance a random close fits |
|---|---|---|
| About 58,500 | 0.41% | 48.6% |
| About 86,600 | 0.34% | 58.9% |
| About 124,800 | 0.28% | 70.6% |
Adding the three chances gives 1.78 expected fits from three points by luck alone. We got one. That is slightly under what chance gives, and three points cannot say anything either way. Read it as an example of how to test, not as evidence for or against the method.
The same arithmetic shows a trap. As bitcoin's price rises the cardinal levels crowd closer together in percentage terms, so any fixed band catches more random prices. A 0.25% band, as used for equity indexes, would catch nearly all prices near 124,800. Add the diagonal levels and almost every close sits near some level. That is why we scored cardinal levels only, with a tight band.
Why a 24/7 market changes the time side
Price is half of Gann work. The other half counts time, usually in calendar days or degrees, for example 90, 180 or 360 days from a low. Bitcoin makes that count different from a stock index in a few ways:
- Every day has a close. Our data holds 660 daily closes across 660 calendar days, with no gaps. A stock index closes about five days in seven, so a count of 90 days lands on a day with no trading roughly two times in seven. For bitcoin the date always exists.
- The "close" is a convention. Yahoo's daily bitcoin close is taken at midnight UTC, which is 10 am in Queensland. There is no closing bell and no overnight gap. A count that lands on a date is a count to a time of day you chose.
- Calendar days and trading days agree. From the 30 June 2026 low to the 22 October 2026 data is 114 calendar days and 114 daily closes. In a stock index the same stretch holds roughly 80 sessions, so a "114 day" count and a "114 bar" count mean different things. In bitcoin they are the same thing.
- Weekends are part of the series. Nothing pauses on a Saturday, so weekend closes count in every date you work out.
None of this says time counts work. It only tells you the count is cleaner to define for bitcoin, and just as important to test against chance before you rely on it. The same date-matching trap applies: with enough dates in a year, something will land on a turn.
Common mistakes
- Choosing the anchor after seeing the chart. Pick it by a rule, as we did here.
- Counting only the hits. Note every level the market ignored, and count the near fits that chance would have given you.
- Using the same band at every price. Bitcoin has moved from about 58,500 to about 124,800 in our window, and the chance of a fit moved from 49% to 71% with it.
- Mixing closes and intraday prices. Choose one and keep to it. Bitcoin's intraday ranges are wide: on 5 February 2026 it traded between 62353.54 and 73161.55 and closed at 62702.10.
What this does not tell you
The ladder gives price levels, not direction, and not whether a level will hold. Three points cannot confirm or reject a method. A stronger test would score many swing points over many years, or a written call with a date and a rule, as we do in our gold example. The positive side is that the app makes this check fast and repeatable for any market. The same steps for WTI crude take a few minutes, and our post on what the app does well shows the other modules.
This is research and education, not financial advice.
Try it yourself
Create a free account at crohamhurst.app, open Gann Square of Nine, and enter a swing low you chose by a rule. The Square of Nine guide walks through every field, and the free calculator works without an account.
Crohamhurst computes the Square of Nine, Bradley siderograph, planetary ephemeris, cycle scans and historical analogs from your own price data, in your browser. The free plan needs no card.
Create free account