Gann Square of Nine Calculator: A Worked Example on WTI Crude Oil
To use a Gann Square of Nine calculator, enter one price and read the ladder of levels it returns. For WTI crude oil at 91.85 the app lists cardinal levels at 81.00, 90.25, 100.00 and 110.25, with diagonal levels between them at 85.56, 95.06 and 105.06. We tested them against the last month of prices and the grid lined up only sometimes.
What the calculator does
The Square of Nine is a number spiral. Take the square root of a price, move along the spiral in steps of a quarter or half a turn, and square the result. The output is a ladder of prices that share an angle with your starting price. The app marks the levels on 0, 90, 180 and 270 degrees as cardinal (the strongest in Gann's teaching) and the 45 degree ones as diagonal.
We cover the history and the idea in our Square of Nine guide. This post is the how-to.
Step by step
It costs 1 compute unit.
- Sign in at crohamhurst.app and open the dashboard.
- Choose Gann Square of Nine.
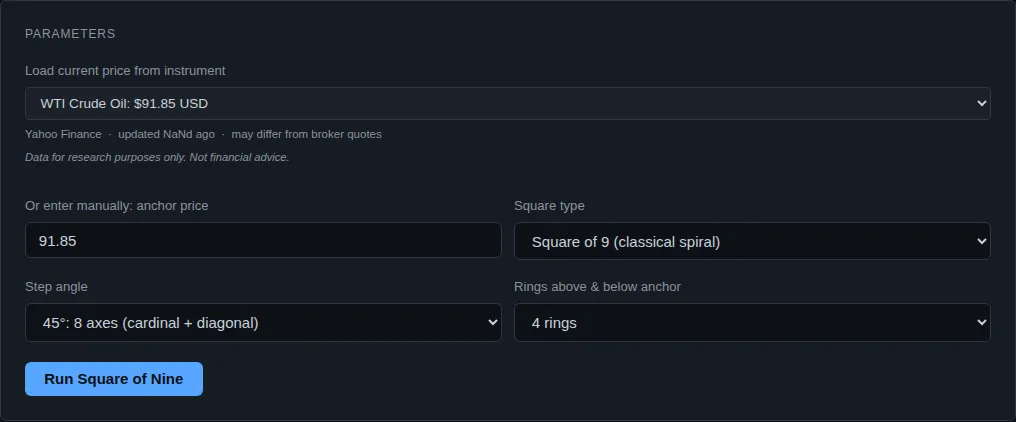
- In the instrument list choose WTI Crude Oil. The anchor box fills with the last price, 91.85 (the 9 October 2026 close from Yahoo Finance, ticker CL=F). You can also type any price in by hand.
- Leave the step at 45 degrees.
- Press Run Square of Nine.
Reading the result
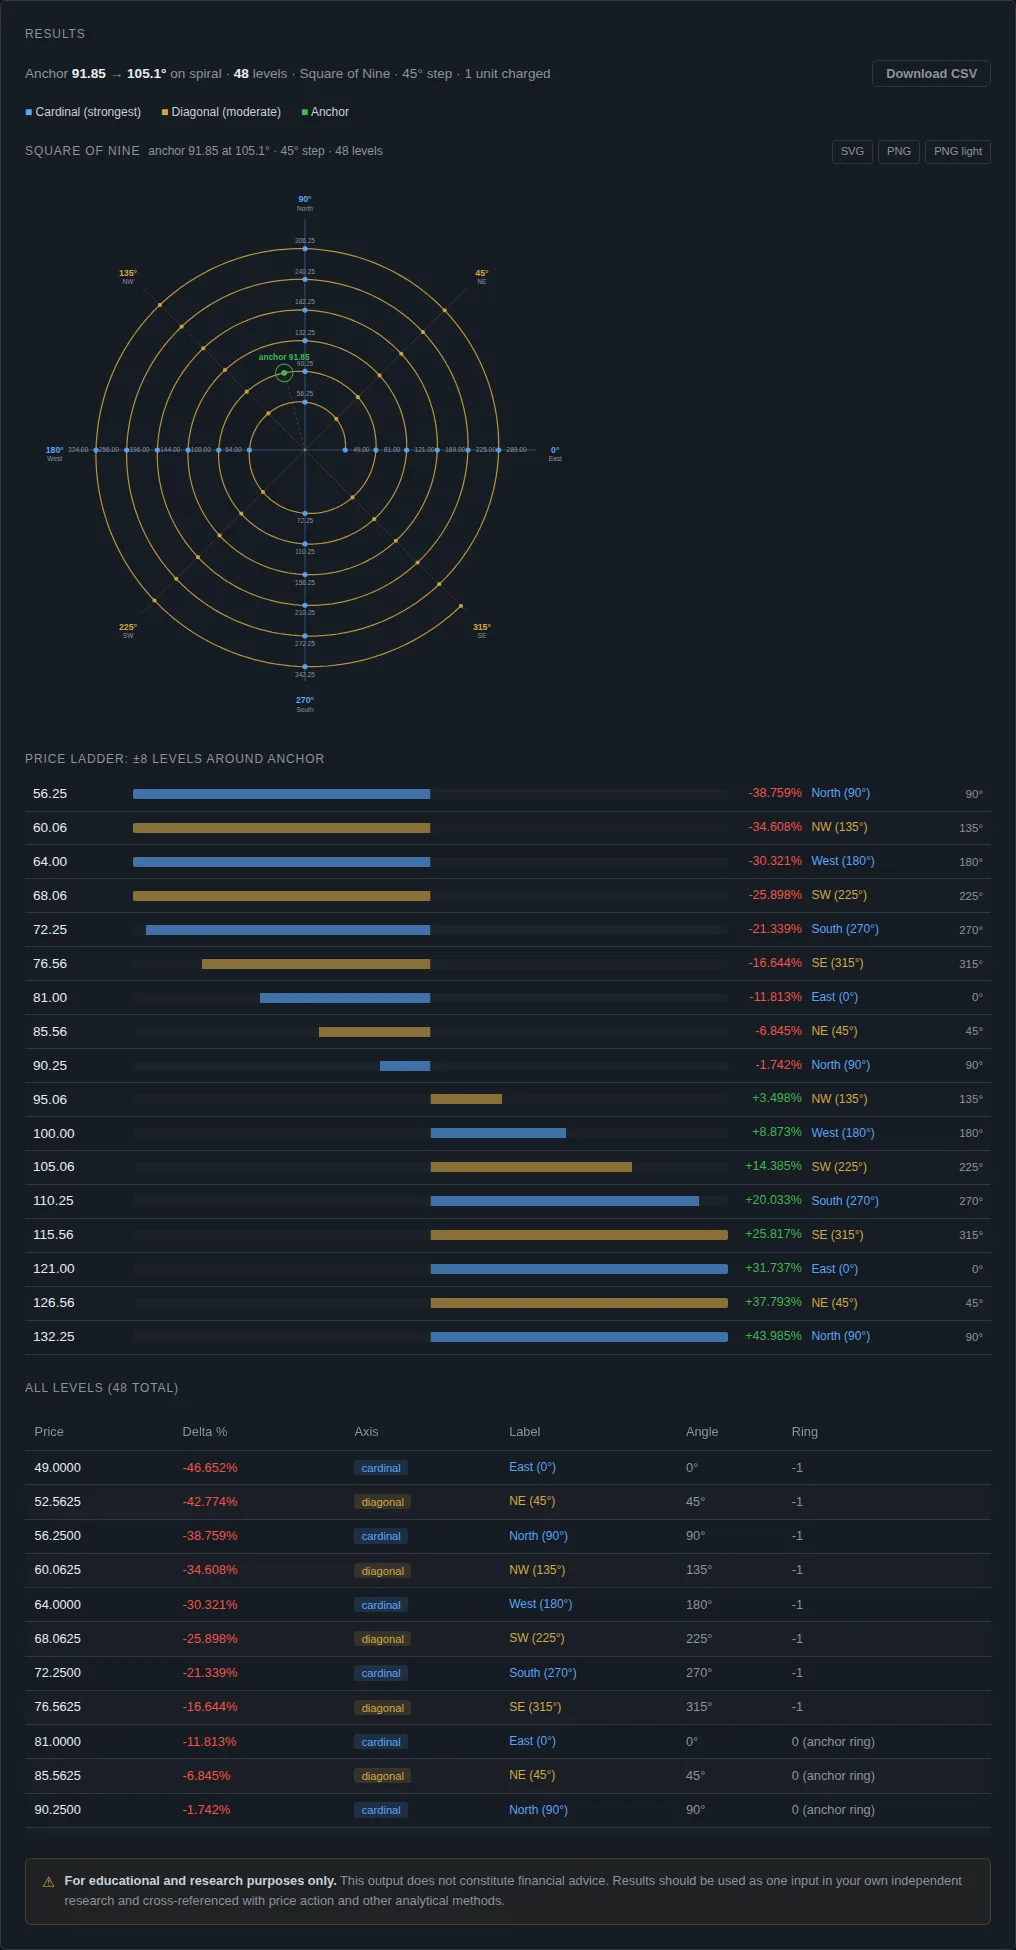
The app puts 91.85 at 105.1 degrees on the spiral. The ladder around it:
| Level | Type | Distance from 91.85 |
|---|---|---|
| 81.00 | Cardinal (East) | -11.81% |
| 85.56 | Diagonal (NE) | -6.85% |
| 90.25 | Cardinal (North) | -1.74% |
| 95.06 | Diagonal (NW) | +3.50% |
| 100.00 | Cardinal (West) | +8.87% |
| 105.06 | Diagonal (SW) | +14.39% |
| 110.25 | Cardinal (South) | +20.03% |
The nearest level below the price is 90.25 and the nearest above is 95.06. A trader using the method would watch those two. The columns you can ignore at first are Ring and Angle. They say which turn of the spiral each level is on.
A detail worth knowing: these levels are squares of multiples of 0.25. 9.5 squared is 90.25, 10 squared is 100. They do not depend on the anchor price you enter. The anchor decides which section of the grid you see. So the same 90.25 level appears whether you anchor at 91.85 or at 88. If you want to see this, try our free calculator with two different anchors.
Checking it against the last month of prices
We pulled WTI daily closes for the month to 9 October 2026 from Yahoo Finance (CL=F).
- The closing high was 105.83 on 15 September. The nearest level is the 105.06 diagonal, 0.73% below it.
- The closing low was 88.28 on 7 October. The nearest level is the 90.25 cardinal, 2.2% above it.
So the high stopped close to a diagonal level, and the low went through the cardinal level by 2.2%. That is one near fit and one clear miss, from two points. It does not support the method and it does not rule it out. For a pre-registered test with a scoring rule see our gold example.
What to do next
Run it on a market you follow with the price at a swing high or low. Note which levels the market reacted at and how often it did not. Count the reactions that would have happened anyway. Our gold post shows the chance maths: with gold levels about 1.5% apart, a random price lands within 0.25% of one about a third of the time. Oil levels here are about 5% apart, so the chance of a random hit is lower.
Common mistakes
- Moving the anchor to fit a level you like. If you try ten anchors you will always find one whose levels line up with something. Pick the anchor by a stated rule first.
- Ignoring how many levels there are. The ladder has a level every few percent. With that many lines, price will pass near one often.
- Mixing units. Enter the price as the chart shows it. Oil is in dollars a barrel, so 91.85 and not 9185.
What this does not tell you
The ladder gives price levels, not direction. It does not tell you whether oil will rise or fall or whether a level will hold. Treat each level as a place to check, not a signal.
Questions people ask
How do I use a Gann Square of Nine calculator? Enter a price and read the levels above and below it. Cardinal levels are the strongest in the method, diagonal levels are moderate.
What price should I start from? Traditionally a significant high or low. There is no agreed definition of significant, so say how you chose it before you test.
Is the calculator free? Yes. The in-app version costs 1 compute unit and we also have a no-account calculator page.
Does it work on oil? It will run on any positive price. Whether the levels mean anything for oil is what you test.
General information only. This is not financial advice. Past patterns do not guarantee future results. Consider your own circumstances, or speak to a licensed financial adviser, before making any investment decision.
Crohamhurst computes the Square of Nine, Bradley siderograph, planetary ephemeris, cycle scans and historical analogs from your own price data, in your browser. The free plan needs no card.
Create free account