Planetary ingress chart trading: how ingress dates are used
A planetary ingress is the instant a planet crosses from one 30 degree zodiac sign into the next. Market astrologers use these dates as a calendar of moments to watch, and the Sun's entry into Aries each March (the equinox) is the one most often drawn as a "chart". The dates are exact astronomy. Whether a market does anything on them is a separate question, and it is one you can test.
This post runs a real example in the Crohamhurst app, shows what a trader reads from it, and lays out how to check an ingress idea against chance.
What the app computes exactly
The ingress module finds every sign crossing for the bodies you pick, between two dates. It uses the JPL DE421 ephemeris, takes a daily look at each body, then narrows each crossing down by bisection to a 60 second window. The result is a time-ordered table, accurate to the minute, for any date from 1900 to 2050.
That is the part that is hard by hand and quick in software: eight crossings in two months, each with a UTC time, found in seconds. Retrograde re-entries are listed too, so a planet that backs over a boundary and crosses again shows up as separate rows.
Worked example: the March 2026 Aries ingress
We opened the Ingress module on the free plan, set the range to 1 March to 30 April 2026, kept the six default bodies (Sun, Mercury, Venus, Mars, Jupiter, Saturn) and the geocentric frame, and ran it. The range cost 1 compute unit.
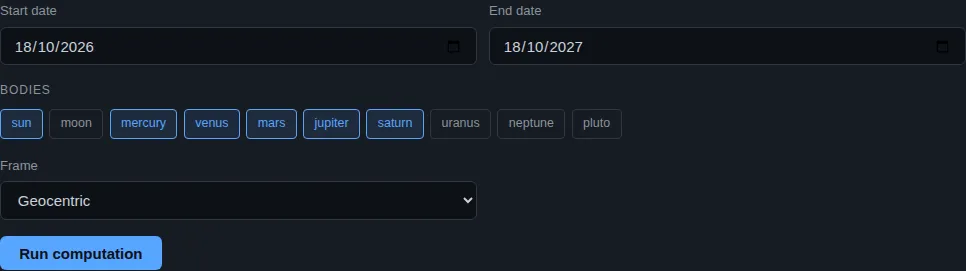
The form is short: two dates, a row of body chips and a frame. The results came back as eight crossings.
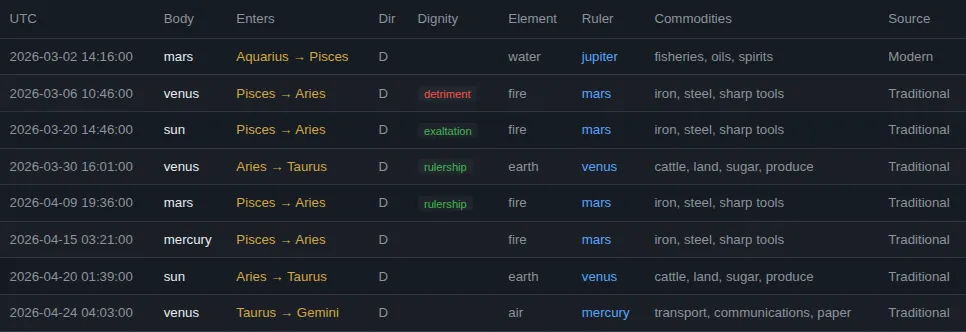
| UTC | Body | Enters | Dignity |
|---|---|---|---|
| 2 Mar 14:16 | Mars | Aquarius to Pisces | none |
| 6 Mar 10:46 | Venus | Pisces to Aries | detriment |
| 20 Mar 14:46 | Sun | Pisces to Aries | exaltation |
| 30 Mar 16:01 | Venus | Aries to Taurus | rulership |
| 9 Apr 19:36 | Mars | Pisces to Aries | rulership |
| 15 Apr 03:21 | Mercury | Pisces to Aries | none |
| 20 Apr 01:39 | Sun | Aries to Taurus | none |
| 24 Apr 04:03 | Venus | Taurus to Gemini | none |
The headline row is the Sun entering Aries at 14:46 UTC on 20 March 2026. In Brisbane that is 12:46 am on 21 March. The table also shows three more bodies (Venus, Mars and Mercury) crossing into Aries within about six weeks of it. That stack is the sort of thing the wheel view in the app makes easy to see.
How traders read an ingress
Practitioners read an ingress in a few ways. These are traditions, not results:
- The cardinal ingress as a seasonal chart. The Sun entering Aries, Cancer, Libra and Capricorn marks the four seasons. Some astrologers cast a chart for the exact moment and treat it as a frame for the following three months.
- Which signs are busy. Several bodies crossing into the same sign in a short window is read as emphasis on that sign's themes.
- Dignity. The app marks whether the body is in its own sign (rulership), its exaltation, detriment or fall. Dignity is worked out from the traditional rulership tables, not typed in. Venus entering Taurus on 30 March is a rulership row, for example.
- Commodity associations. Classical tables link signs to commodities, such as Leo to gold. The app shows these with a source label (Gann, Traditional or Modern), so you can see which are quoted from the literature. They are quoted conventions, not computed facts, and the app says so.
Only the dates and the dignity badges are calculated. The commodity column is a lookup from the literature, and we have not tested it against price.
What the S&P 500 did around this one
We pulled S&P 500 daily closes (ticker ^GSPC, Yahoo Finance, fetched 19 October 2026) and looked at the 2026 Aries ingress as a single descriptive case:
- Close on 19 March 2026: 6,606.49.
- Close on 20 March 2026, the day of the ingress: 6,506.48, which is 1.5% lower on the day. (20 March was also the third Friday of the month, when index options and futures expire, and volume that day was the heaviest in the window. That alone can move a session.)
- The lowest close in the following weeks was 6,343.72 on 30 March, 2.5% below the 20 March close.
- Close on 20 April 2026, when the Sun left Aries: 7,109.14, which is 9.3% above the 20 March close.
The arithmetic is each close divided by the 20 March close, minus one. That is one year and one market, with the S&P 500 dropping on the day, dipping, then rising strongly. It shows what a descriptive look at an ingress involves. It does not show a pattern. Had the index rallied on the day, the story would read just as neatly in the other direction, which is exactly why a single case proves nothing.
How to test an ingress idea yourself
A single example is where a test starts. If you want to know whether ingress dates mean anything for a market you trade, do this:
- State the rule first. For example: "the close on the Sun's Aries ingress date is lower than the close ten trading days later". Write it down with the market and the date range before you look at results.
- Pull the dates from the app. Run the Ingress module over up to ten years at a time (2 units a year, so a decade costs 20 units on the free plan's 50 a day).
- Pull the prices. Daily closes for your market from a source you trust, and note the ticker and dates.
- Compare with a luck baseline. Take the same measurement on many ordinary dates, not ingress dates, and see how often it comes out the same way. If your rule works about as often on random days, the ingress added nothing.
- Count honestly. Twenty equinoxes is a small sample. More signs and more bodies means more chances to find something by luck, so keep the rule narrow.
Our post on backtesting cycle methods goes through the baseline step in more detail, and computing planetary aspects explains the ephemeris precision behind the dates.
What this does and does not give you
The app gives you exact, repeatable dates and a clean place to test an idea before you rely on it. The guide at /guides/ingress.html covers every field, the retrograde rows and the CSV export, which is handy for a spreadsheet test.
What it does not give you is a trading signal. A published seasonal or calendar effect, where one exists, is an average over many years and not a call for next week. An ingress date is a date, not a direction.
This is research and education, not financial advice.
Try it yourself
Open a free account at /app/register, choose the Ingress and rulership module, and run your own date range. Then read the ingress guide for the full walkthrough, and test your rule against ordinary days before you trust it.
Crohamhurst computes the Square of Nine, Bradley siderograph, planetary ephemeris, cycle scans and historical analogs from your own price data, in your browser. The free plan needs no card.
Create free account