Historical Planetary Analogs: How to Find Past Dates With the Same Sky, and What to Check
The Historical Analogs module takes a target date, compares the planetary positions on that day with every day in a window of past years, and returns the dates that match best. For 1 November 2010 and a 50 year scan, the best match is 15 November 2008 at 75.2% similarity. The check we ran afterwards, against rainfall, was a clear miss.
What an analog is
An analog here is a past date whose planets sat in nearly the same places as on your target date. The app measures the average distance in ecliptic longitude between each planet's position then and now, and turns it into a similarity percentage. It keeps your chosen number of best dates and makes sure they are at least 365 days apart, so you get separate episodes rather than five neighbouring days.
It stops the scan one year before the target date, so an analog is always from the past. That is what makes a before-and-after test fair. The Historical Analogs guide has the full rules.
Step by step
This costs 5 compute units for a 50 year scan.
- Sign in at crohamhurst.app and open the dashboard.
- Choose Historical analogs.
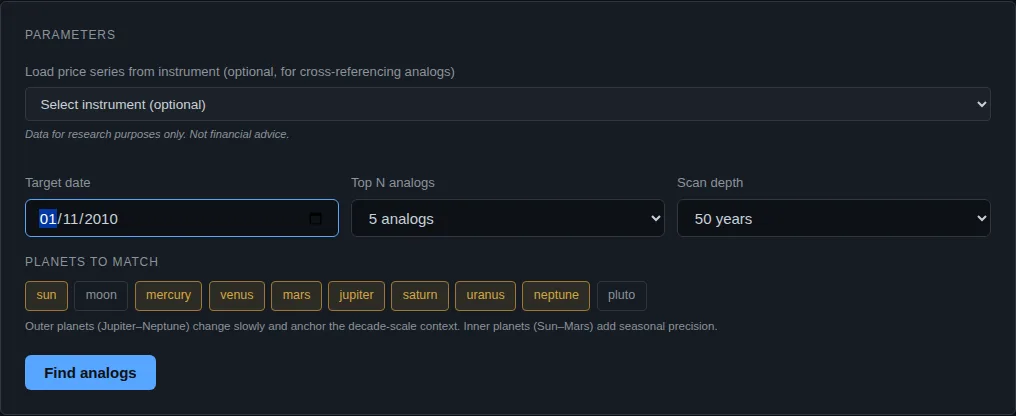
- Set Target date to 1 November 2010.
- Set Top N analogs to 5 and Scan depth to 50 years. Leave the planet chips at their defaults.
- Press Find analogs. It takes 10 to 30 seconds.
Reading the result
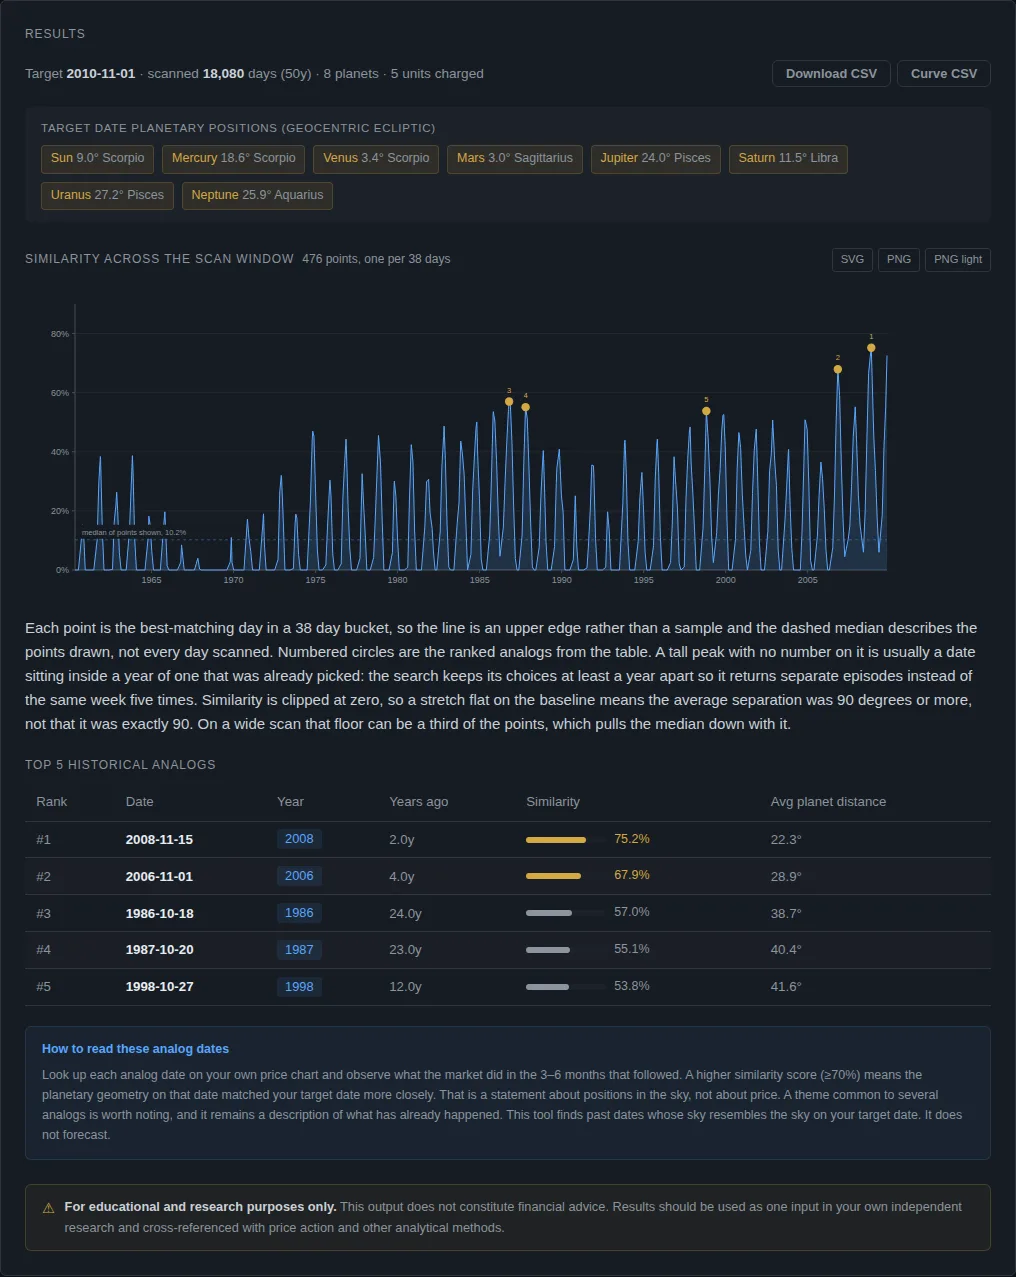
The scan covered 18,080 days. The app also lists the planetary positions on the target date (for example Jupiter at 24.0 degrees Pisces and Saturn at 11.5 degrees Libra) so you can see what was matched.
| Rank | Date | Similarity | Average distance |
|---|---|---|---|
| 1 | 2008-11-15 | 75.2% | 22.3 degrees |
| 2 | 2006-11-01 | 67.9% | 28.9 degrees |
| 3 | 1986-10-18 | 57.0% | 38.7 degrees |
| 4 | 1987-10-20 | 55.1% | 40.4 degrees |
| 5 | 1998-10-27 | 53.8% | 41.6 degrees |
Two things to take from the table.
- Similarity falls fast. The top two are reasonable matches. Three to five are about 40 degrees away on average, which is not close. The app's own guide treats 70% and above as a strong match, so only the first qualifies.
- The curve matters. The chart shows similarity across the whole scan. A single tall peak means one real match. A flat field of similar peaks means any date would do.
The check: what happened next
The app tells you to look at what followed each analog. We did that for rainfall. The data is NOAA GHCN-Daily at Beerburrum Forest Station in south-east Queensland (station ASN00040284), summing daily rainfall for November to the following January.
| Analog | Summer total (mm) |
|---|---|
| 2008 | 452.6 |
| 2006 | 199.8 |
| 1986 | 455.6 |
| 1987 | 321.4 |
| 1998 | 396.6 |
The median of those five summers is 396.6 mm. The median of all 59 complete summers before 2010 is 389.7 mm. So the analogs told us nothing: they sat on the long-run middle.
The actual summer of 2010 to 2011 at Beerburrum was 1,287.4 mm, about 3.2 times the analog median (1287.4 divided by 396.6). That was the summer of the major Queensland floods. The analog method did not see it.
We report it because a how-to that only shows hits teaches the wrong habit. Pick one outcome, write the check down before you look, and count the misses.
What to do next
Run the module for a date that matters to you. Choose the outcome before you look at the analogs. Compare with a baseline (here, the long-run median). For a larger test of the same idea, with a forward call, see our south-east Queensland rainfall post. Our earlier rainfall analogs post covers the Australia-wide idea.
Common mistakes
- Choosing the outcome after seeing the analogs. Decide what you will check (rainfall, a market) before you open the table.
- Counting only the strong match. The first analog here was the best sky match but it is one summer. Use the median of several.
- Comparing with nothing. An analog median only means something against a baseline such as the long-run median.
What this does not tell you
Similar sky does not mean similar weather or similar prices. Analogs describe where planets were. The module does not forecast, and the 2010 example shows how far off a reading of it can be.
Questions people ask
What are historical planetary analogs? Past dates when the planets were in similar positions to a date you choose, ranked by similarity.
How many analogs should I ask for? Five to ten. More brings in weak matches. In our run the fifth was already 41.6 degrees off on average.
How far back should I scan? The scan depth ranges from 20 to 100 years. Longer scans find closer matches but cost more units: 5 for 50 years, 10 for 100.
Can I use it on any market? The dates depend only on planets. You choose what to check afterwards.
General information only. This is not financial advice. Past patterns do not guarantee future results. Consider your own circumstances, or speak to a licensed financial adviser, before making any investment decision.
Crohamhurst computes the Square of Nine, Bradley siderograph, planetary ephemeris, cycle scans and historical analogs from your own price data, in your browser. The free plan needs no card.
Create free account