How to Read the Planetary Aspect Timeline, With a March 2020 Example
The planetary aspect timeline is a chart with one row for each pair of planets and one marker for each day that pair reached an exact angle. Read it in four steps: find the lane, read the marker, look at the density band, then match a marker to its row in the event table for the date and the orb. This post does all four on the weeks around the March 2020 market low.
The timeline shows geometry. It does not forecast anything, and we say so again at the end.
Why the weeks around 23 March 2020
We picked one stated date so the example has something to check against. The S&P 500 closed at 2,237.40 on 23 March 2020. That was the lowest close in the data we pulled (^GSPC, 18 February to 15 April 2020, Yahoo Finance via yfinance, fetched 8 November 2026). It was 33.9% below the 3,386.15 close of 19 February 2020, which was the highest close in the same data. By 15 April the index had closed at 2,783.36, which is 24.4% above the low.
Those are the arithmetic: low divided by high minus one, and the April close divided by the low minus one, using closing prices only.
We then asked the app one question: which hard and soft aspects between the slower planets landed in the six weeks around that date?
Set up the run
Open the Ephemeris module and fill the parameter card:
- Start date 1 March 2020, end date 15 April 2020.
- Planets: mercury, venus, mars, jupiter, saturn and pluto. We switched the Sun and the Moon off.
- Aspects: all five, which are conjunction, opposition, square, trine and sextile.
- Orb 1.5 degrees, frame geocentric.
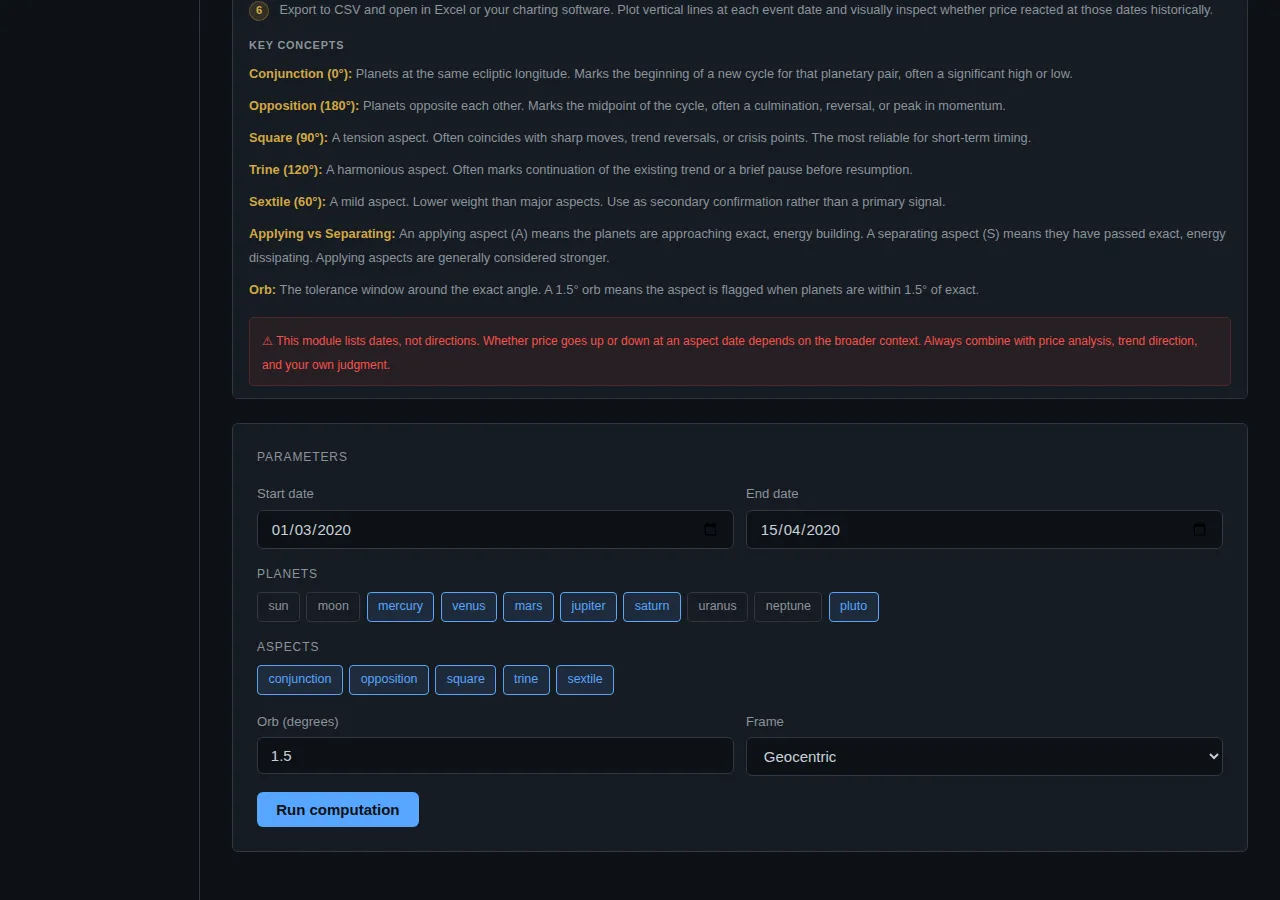
The run cost 2 compute units. Positions come from the JPL DE421 ephemeris through the Skyfield library, which is the standard source for this kind of work. Every date below was computed in a few seconds, not looked up in a printed table.
Why leave the Moon out? It aspects every other body about once a month and supplies most of the events in any run that includes it. In the example in our ephemeris guide, 165 of 257 events involved the Moon. For a question about the slower planets, the Moon is noise. If you do want it, the chart has a Hide Moon pairs button that strips those lanes back out.
Read the chart part by part
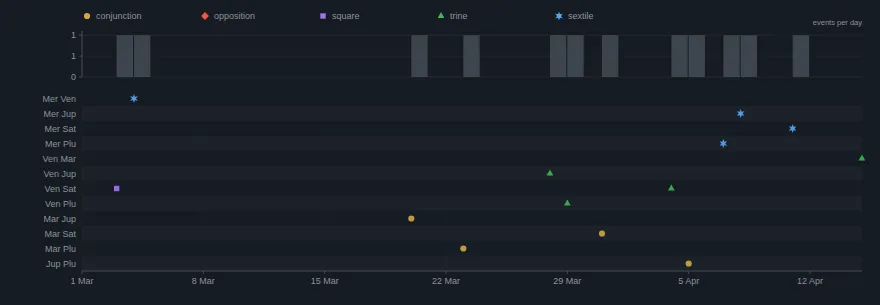
Lanes
Each row is one planet pair, labelled with short names such as Mar Jup for Mars and Jupiter. This run shows 12 lanes. Six bodies make 15 possible pairs, but a lane only appears when that pair reached one of the chosen aspects inside the orb during the window. The three pairs with no events are left out.
Markers
The horizontal axis is the calendar, here 1 March to about 15 April. A marker sits on the day the pair came closest to the exact angle. The marker is both a shape and a colour, so the chart still reads in greyscale:
- Gold circle: conjunction (0 degrees).
- Red diamond: opposition (180).
- Violet square: square (90).
- Green triangle: trine (120).
- Blue six point star: sextile (60).
In this run there are no oppositions, so no red diamonds. Three gold circles stand out: Mars and Jupiter, Mars and Pluto, and Jupiter and Pluto. Those are the tightest alignments of the window.
The density band
The grey band above the lanes counts events in four day buckets, across all lanes at once. A tall bar means several pairs reached exactness within the same few days. Here the bars come in pairs and singles through March and April with a gap in the first half of March. It tells you when the sky was busy and when it was quiet. It does not tell you which of those periods mattered.
Match a cluster to the event table
The table beneath the chart holds the same events with numbers.
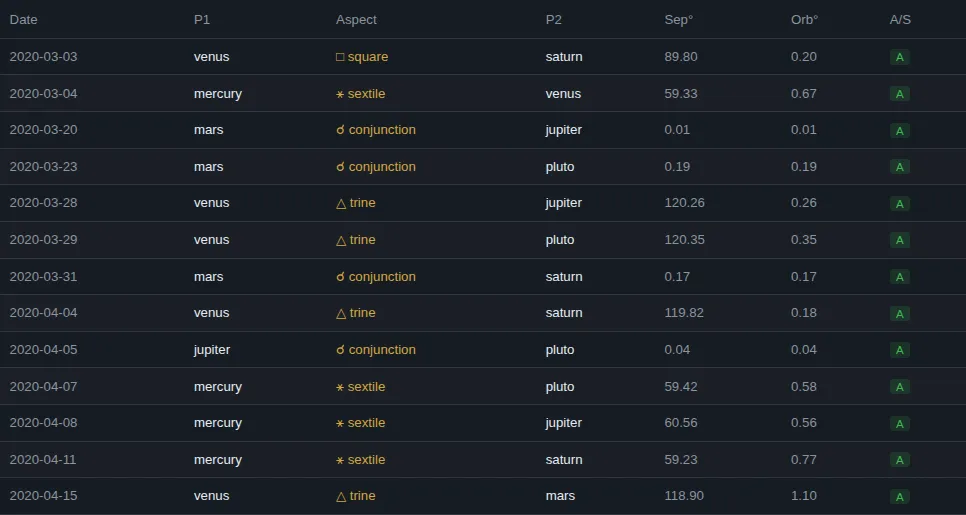
Thirteen events in all. The ones in the third week of March:
| Date | Pair | Aspect | Separation | Orb |
|---|---|---|---|---|
| 2020-03-20 | Mars, Jupiter | conjunction | 0.01 degrees | 0.01 |
| 2020-03-23 | Mars, Pluto | conjunction | 0.19 degrees | 0.19 |
| 2020-03-28 | Venus, Jupiter | trine | 120.26 degrees | 0.26 |
| 2020-03-29 | Venus, Pluto | trine | 120.35 degrees | 0.35 |
Read the columns like this:
- Date is the day of closest approach at daily resolution. The scan samples at 12:00 UT, so treat it as a day, not a moment.
- Separation is the actual angle between the pair that day.
- Orb is the distance from the exact angle, which is the precision column. 0.01 on Mars and Jupiter is as tight as a daily scan can report. 0.26 and 0.35 on the two trines are loose by comparison.
- A/S is the applying or separating flag. Ignore it. Every reported day is a local minimum, so the flag reads A almost everywhere, and our guide explains why.
So the cluster is real and measurable: Mars met Jupiter on 20 March and Pluto on 23 March, the same day as the S&P 500 closing low. Mars then met Saturn on 31 March, and Jupiter met Pluto on 5 April.
What the market did, and why that proves little
Here is the straight reading. The Mars and Pluto conjunction (orb 0.19) fell on the day of the lowest close in our data. That is a match.
It is also easy to overread, for three reasons.
First, the Mars and Jupiter conjunction three days earlier, on 20 March, was the tightest event in the window, and it was not a turn. The S&P 500 closed at 2,304.92 that day and then fell another 2.9% to 2,237.40 on 23 March.
Second, there are 13 events in 46 days, one about every 3.5 days. With that density, nearly any date you care to name has an aspect within a couple of days of it. A match near a turning point is what we would expect to see often by chance.
Third, one episode is one episode. The only honest way to find out whether aspect dates line up with turns more than chance allows is to test many of them against a luck baseline, and to write the rule down before looking. That is how we score our tracked calls.
So the example shows the module doing what it is built for. It gives exact dates, fast, from a standard ephemeris, and it makes the question testable. It does not show that the sky moved the market that week.
Practical tips
- Ask one question per run. Two to four bodies and the aspects you actually use give a table you can read.
- Pick a stated date or event first, then look at the timeline. Looking at the chart first and finding a story afterwards is how coincidences get promoted into rules.
- Use the density band to see bunching, then the table to see how tight each member of the bunch is.
- For any pair involving the Moon, use an orb of 7 degrees or more, because the Moon moves about 13 degrees a day and can slip between daily samples.
- Export the CSV, which is free, and plot the dates on your own price chart.
What the timeline does not tell you
It tells you when a geometric configuration happens. It says nothing about what a market will do on or after that date, and it does not rank one aspect above another. A published average effect in the research literature, such as the lunar and seasonal studies we cover elsewhere on this blog, is an average over many years. It is not a signal for next week.
This is research and education, not financial advice.
Try it yourself
Run the same window in the app and compare every number with this post. Create an account, open the Ephemeris module and use the settings above. The ephemeris guide covers every field, and our post on computing planetary aspects explains how the positions are checked.
Crohamhurst computes the Square of Nine, Bradley siderograph, planetary ephemeris, cycle scans and historical analogs from your own price data, in your browser. Plans start at $49 a month.
Create an account